The United States came out of the Second World War owing more than a year’s national income and spent the next three decades running budget deficits in most years. By 1974 the debt was under a quarter of national income. Nobody paid it down. The ratio fell because the economy grew, in real terms and in prices, faster than the interest the Treasury was paying on the old bonds. That gap, between the interest rate on the debt and the growth rate of the economy, is the whole of debt dynamics. It decides whether a government that never runs a surplus sees its debt shrink or explode, it decides how large a surplus a government in the other position must run just to stand still, and since 2022 it has been moving against almost every treasury in the world at once.
The arithmetic fits in one line, and it is worth learning because every debt-sustainability judgement, from the IMF’s assessments of Pakistan and Egypt to the bond market’s view of France and Japan, is an argument about the three numbers in it: the interest rate, the growth rate and the primary balance. The article sets out the equation, shows what each term is made of, and then looks at the argument that has run since 2019 about whether a world in which the rate sits below growth makes public debt a free lunch. The answer turns out to be that it lowers the price of lunch without making it free, and the difference matters most for the governments least able to afford the bill.
One Equation Moves Every Debt Ratio
Write the debt as a share of GDP, call it d, and ask what changes it from one year to the next. Two things. The government pays interest on the existing stock, which adds to the debt, while the economy grows, which shrinks any given debt as a share of output. And the government runs a primary balance, its revenue minus its spending before interest, which either pays some debt down or adds to it. Put together, with r the interest rate on the debt, g the growth rate of nominal GDP and pb the primary balance as a share of GDP:
The first term is the one that gives the subject its name. If the interest rate exceeds the growth rate, the existing debt grows faster than the economy carrying it, and the ratio rises on its own even when the budget before interest is balanced. If growth exceeds the rate, the ratio falls on its own, and a government can run a modest primary deficit forever without the ratio rising. The second term is the government’s own choice, and it works in the obvious direction: a surplus lowers the ratio, a deficit raises it. Everything else that happens to public debt, bank bailouts, privatization receipts, exchange-rate movements on foreign-currency borrowing, gets a third term called the stock-flow adjustment, which the next section returns to.
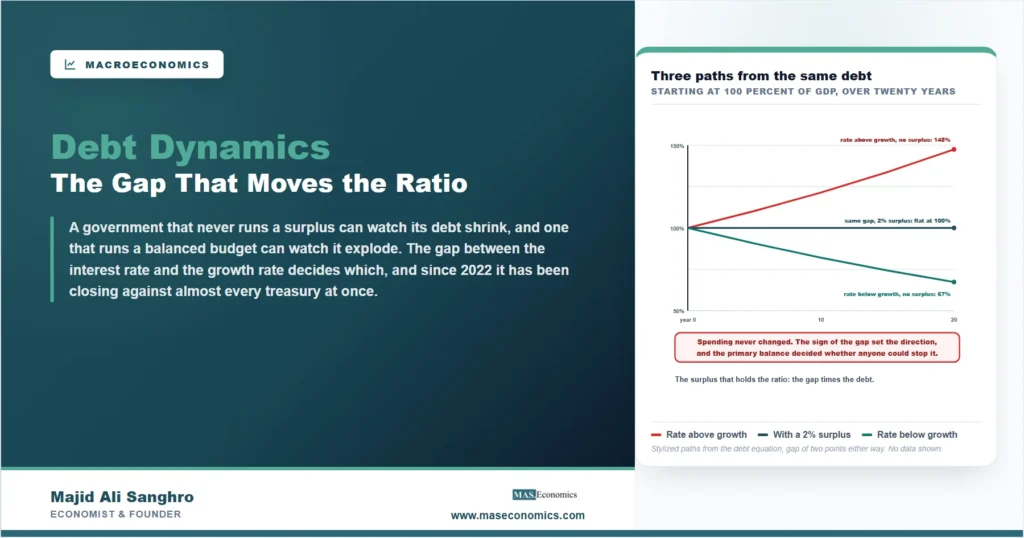
The equation answers two questions at once. The first is what happens if the government does nothing. Take a debt of 100 percent of GDP, an interest rate of 4 percent and nominal growth of 2. The gap is 2 points, so with a balanced primary budget the ratio rises by close to 2 points a year, and after twenty years it is near 148 percent. Reverse the numbers, growth of 4 and a rate of 2, and the same passive government watches the ratio fall to 67 percent over the same twenty years while doing nothing at all. The second question is what it takes to hold the ratio where it is, and the equation gives that directly by setting the change to zero. The debt-stabilizing primary balance is the gap times the debt:
With the first set of numbers, holding 100 percent of GDP steady needs a primary surplus of about 2 percent of GDP every year, before a single point of the debt is repaid. Double the gap or double the debt and the required surplus doubles with it. This is why the same primary surplus that would be comfortable for one country is a fiscal crisis for another: the number that has to be hit depends on a gap the government does not control, multiplied by a stock it inherited.

Stylized paths computed from the debt equation with a starting debt of 100 percent of GDP, nominal growth of 2 or 4 percent and an interest rate of 4 or 2 percent. No data is shown.
What the Rate and the Growth Rate Are Made Of
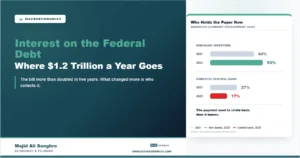
The r in the equation is not the interest rate in the news. It is the effective rate, the interest bill this year divided by the debt at the start of the year, and it is an average over every bond the government has ever issued and not yet repaid. A treasury that borrowed for ten years in 2020 at close to nothing is still paying close to nothing on those bonds in 2026, whatever the central bank has done since. This is why the rise in market rates after 2022 reached the effective rate slowly, bond by bond as the old ones matured, and why the interest bill on the American debt, traced in our article on where the interest on the federal debt goes, kept climbing for years after the rate rises stopped. The longer the average maturity of the debt, the slower the pass-through, which is the one reason treasuries pay a little extra to borrow long, described in our introduction to how governments borrow.
The g is nominal growth, real growth plus inflation, because the debt is a nominal quantity and inflation shrinks it as surely as output does. This is the term that did most of the work after 1945. Real growth in the advanced economies was strong, inflation ran ahead of the interest rates that regulation held down, and the combination, which Carmen Reinhart and Belen Sbrancia later named the liquidation of government debt, took the American ratio from over a hundred percent to the low twenties without a single year of debt repayment. Inflation that is expected does not help, since lenders price it into the rate; inflation that surprises the holders of long bonds does, once, and at the cost of the government’s credibility the next time it borrows. The inflation of 2021 to 2023 ran the same mechanism in miniature, lowering debt ratios across the advanced economies even as deficits stayed large, before the higher rates that followed began to reverse it.
The third term, the stock-flow adjustment, is where debt changes for reasons the budget never shows. When a government takes over a failing bank’s liabilities, the debt jumps with no deficit. When it sells an asset, the debt falls with no surplus. And when part of the debt is in a foreign currency, a depreciation raises the debt in domestic terms overnight, which is the route by which a currency crisis becomes a debt crisis. For an economy that borrows in dollars, the r in the equation includes the expected fall in its own currency, and a growth rate that looks comfortable in rupees or pesos can be far below the effective cost of the debt in the currency it was borrowed in. Argentina’s history, set out in our case study of its recurrent defaults, is a sequence of exactly that arithmetic.
Why the Sign of the Gap Decides Everything
For most of the twentieth century’s second half, growth in the advanced economies exceeded the rate on their debt, and the ratios drifted down. The 1980s reversed the sign. Disinflation raised real rates, growth slowed, and for the first time in decades the passive path pointed upward; the debt ratios of Italy, Belgium, Canada and others climbed through the decade with primary budgets that were not far from balance. The fiscal consolidations of the 1990s were the response, and the size of the primary surpluses they needed, Italy’s and Belgium’s above 4 percent of GDP for years, is the second equation at work: a large debt times a positive gap is a large surplus, indefinitely.
Then the sign flipped back. From 2009 to 2021 the rate sat below growth in nearly every advanced economy, and in several it sat below zero, so that the passive path pointed down again even at debt ratios far above anything seen since 1945. Governments could run primary deficits and watch their ratios hold steady or fall. Japan is the extreme case, carrying a debt above twice its GDP for years on interest rates close to nothing, and our article on Japan’s return to positive bond yields follows what happens to that arithmetic when the rate starts to move. The gap was the reason the debt of 2020 was so much cheaper to carry than the debt of 1990, and it was the reason a generation of economists began to ask whether the old rules about deficits still applied.
Since 2022 the gap has been closing from both sides. Rates rose everywhere, and although the effective rate lags, it is climbing year by year as cheap bonds mature. Growth in the advanced economies has slowed, and the inflation that flattered the ratios for two years has faded. Our reading of the global fiscal gap closing to zero is the same story told from the deficit side: a passive path that pointed down for a decade now points close to flat or up, and a primary deficit that was harmless when growth did the work is no longer harmless. The cross-country picture, and the stress tests that follow from it, are in our survey of whether the biggest economies can keep borrowing, and this article does not repeat its tables. The point here is the mechanism: none of those countries changed its spending plans between 2021 and 2024, and all of them found the required primary balance moving against them.
| Debt, percent of GDP | Rate minus growth, points | Balance that holds the ratio, percent of GDP | What that means in practice |
|---|---|---|---|
| 60 | +1 | surplus of about 0.6 | Near balance before interest; an ordinary budget does it |
| 100 | +2 | surplus of about 2.0 | A sustained surplus of a kind few governments have held for a decade |
| 120 | +3 | surplus of about 3.5 | The consolidation territory of the 1990s or of a programme country |
| 250 | −1 | deficit of about 2.5 is enough | The Japanese arithmetic while the rate stayed below growth |
|
|
|||
The table reads across as well as down. A country with a modest debt and a small positive gap has an easy target and a large margin for error; a country with a large debt and a large positive gap has a target it may not be able to reach in a democracy, since a primary surplus of 3 or 4 percent of GDP is a permanent transfer from taxpayers to bondholders that has to survive every election. And the fourth row is the one that has caused the most argument, because it says a government with a debt of two and a half times its GDP can run a deficit before interest every year and stand still, as long as the sign of the gap holds. The whole question is whether it holds.
The Free Lunch and Its Fine Print
In January 2019 Olivier Blanchard used his presidential address to the American Economic Association to make the case that the negative gap was not a passing phase. The rate on American debt had been below growth for most of the previous century and a half, he argued, and if that is the normal state of affairs then public debt has no fiscal cost in the usual sense: it can be rolled over forever without ever needing a surplus, and the only cost is the welfare cost of the capital it might crowd out, which is small when the rate is low. The argument was careful, and its author was more cautious than many who repeated it, but its practical reading was clear enough. If growth pays for the debt, the case against deficits weakens, and the case for spending on things with a return above a near-zero rate strengthens.
The fine print arrived quickly, and it has three clauses. The first is that the gap is an average of a variable, not a constant. Neil Mehrotra and Dmitriy Sergeyev showed that even when the rate is usually below growth, the years when it is not are the years that matter, since they arrive in recessions when the primary deficit is also widening, and a debt that was sustainable on average can become unsustainable in a single bad decade. The second is that the rate is not independent of the debt. Lenders charge more to hold more of one borrower’s paper, so a government that uses the free lunch to borrow more raises its own r, and at some level of debt the sign flips as a consequence of the policy that assumed it would not. The market’s charge for that risk is visible in the spread between borrowers with the same currency and different debts, and our article on what high public debt does to a rate cut traces the reverse channel, in which the central bank’s rate decision becomes a decision about the treasury’s solvency.
The third clause is the one that separates the advanced economies from everyone else. The gap is negative when a government borrows in its own currency from lenders who treat its bonds as the safest asset available, which is a description of the United States, Japan and a few others and not of the emerging world. An economy that borrows in dollars faces a rate that includes a currency risk premium and a growth rate that has to be measured in the same dollars, and its gap is positive in most years and sharply positive in the bad ones, when the currency falls and the effective rate jumps. The free lunch is a property of reserve-currency issuers with deep domestic bond markets, which is why the same debt ratio that is unremarkable in Tokyo triggers a programme in Islamabad or Cairo. For those governments the equation’s lesson is the older one: the required surplus is the gap times the debt, the gap is not theirs to choose, and the only term they control is the one that voters feel.
There is a fourth consideration that the equation hides because it treats the rate as given. A government whose debt has grown large enough that the interest bill dominates the budget can lean on its central bank to hold the rate below growth by force, through purchases, ceilings or regulation that obliges banks to hold its paper, and the negative gap that results is manufactured rather than earned. Our article on fiscal dominance is the account of that route, and the postwar liquidation was in part an early version of it. The difference between a gap that is negative because lenders are content and one that is negative because they have been compelled shows up later, in the inflation that the compulsion eventually produces.
Reading a Budget Through the Equation
The equation turns a budget document into three questions, and they are the questions the IMF’s debt sustainability analyses, the rating agencies and the bond desks all ask in their own vocabulary. What is the primary balance, which is the deficit with interest removed, and our guide to what government balances mean separates the two. What is the effective rate on the debt, and how fast is it moving toward the market rate as old bonds mature. And what is nominal growth likely to be over the years the debt will be carried, not the year the budget was written. The full set of tests, including the ones for a currency shock and a growth shock, are in our explainer on how debt sustainability is measured; the equation here is the engine underneath all of them.
Two habits follow. The first is to distrust any debt projection that assumes the gap stays where it was last year, since the cases that went wrong were the ones where the gap moved: Italy in 1992, Greece in 2010, Pakistan in every cycle of the last two decades in which the exchange rate moved before the budget did. The second is to notice which term a proposed policy actually changes. A tax rise or a spending cut moves the primary balance and nothing else. A structural reform that raises growth moves g, slowly, and does more over a decade than any single budget. And a change in the currency of borrowing or the maturity of the debt moves r and the speed at which shocks reach it, which is the term most budgets say nothing about and the term that has ended more governments’ plans than any other.
MASEconomics Explains
3 concepts behind the gap that moves the debt ratio
These concepts are explored in depth across our educational articles library.
Conclusion
The whole of debt dynamics is one equation with three terms. The gap between the interest rate on the debt and the growth rate of the economy, multiplied by the debt already owed, sets the direction the ratio drifts in when the government does nothing; the primary balance is the government’s push against that drift; and the stock-flow adjustment is everything that reaches the debt without passing through the budget. A negative gap made the debts of 2009 to 2021 cheap to carry and let ratios above a hundred percent of GDP hold steady on primary deficits. A positive gap, which is the normal condition for any government that borrows in someone else’s currency and the returning condition for those that do not, turns the same ratios into a permanent demand for surpluses that must survive every election.
The argument about the free lunch was an argument about whether the gap could be relied on. The answer from the evidence is that it is an average of a variable that turns positive in exactly the years a government most needs it not to, that it responds to the borrowing it is used to justify, and that it is a property of a small number of reserve-currency issuers rather than a law of nature. For everyone else, the equation’s older lesson holds. The required surplus is the gap times the debt, the gap is set by lenders and by growth, and the only term the government chooses is the one its citizens pay.
Frequently Asked Questions
What does r minus g mean in public debt?
It is the gap between the effective interest rate a government pays on its debt, r, and the growth rate of nominal GDP, g. When the rate exceeds growth, the debt ratio rises on its own unless the government runs a primary surplus; when growth exceeds the rate, the ratio falls on its own and a modest primary deficit can be run indefinitely.
What is the debt dynamics equation?
The change in the debt-to-GDP ratio equals the gap between the interest rate and the growth rate, divided by one plus growth, multiplied by last year’s debt ratio, minus the primary balance. A further term, the stock-flow adjustment, captures changes to the debt that do not pass through the budget, such as bank rescues or exchange-rate movements on foreign-currency debt.
What is the debt-stabilizing primary balance?
The primary surplus or deficit that keeps the debt ratio constant. It equals the gap between the rate and growth multiplied by the debt ratio, so a debt of 100 percent of GDP with a rate two points above growth needs a primary surplus of about 2 percent of GDP every year just to stand still.
Why did the US debt ratio fall after 1945 without repayment?
Because nominal growth, real growth plus inflation, exceeded the interest rate on the wartime debt for three decades, with regulation and low interest rates holding the rate down. The ratio fell from over 100 percent of GDP to the low twenties by 1974 while the budget was in deficit in most years.
Is public debt a free lunch when r is below g?
It is cheaper, not free. The gap is an average that turns positive in recessions, when deficits also widen; the rate rises as the debt grows, because lenders charge more to hold more of one borrower’s bonds; and the negative gap is a property of reserve-currency issuers with deep bond markets rather than of governments that borrow in foreign currency.
Why does the gap matter more for emerging markets?
Because their effective rate includes a currency risk premium and, for dollar debt, the expected depreciation of their own currency, while their growth has to be measured in the same currency. The gap is positive in most years and jumps in a crisis, when depreciation raises the domestic value of the debt at the moment growth falls.
Thanks for reading! A debt ratio is a race between the interest the past demands and the growth the present delivers, and the budget only decides who is handicapped. Happy learning with MASEconomics