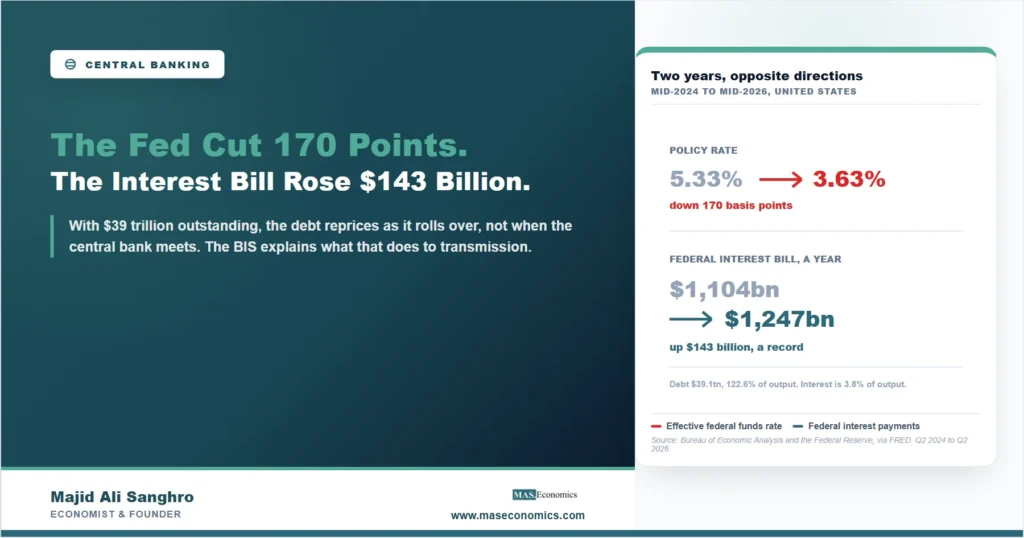
Between the middle of 2024 and the middle of 2026 the Federal Reserve lowered its policy rate by 170 basis points, from an average of 5.33 percent to 3.63. Over exactly those two years the federal government’s annual interest bill rose by $143 billion, from $1,104 billion to a record $1,247 billion. The rate came down and the cost of the debt went up, and the reason is not a paradox but a mechanism. When high public debt reaches the levels now standard across the rich world, a change in the policy rate does something different from what the textbook version promises, and the Bank for International Settlements devoted a section of its 2026 Annual Economic Report to explaining why.
This matters to anyone who has waited for a rate cut to reach a mortgage, a business loan or a savings account. The channel through which a central bank’s decision travels to an ordinary borrower runs through a financial system that is now holding a far larger stock of government bonds than it used to, and that stock changes what the signal does on its way through.
The Bill That Rose While the Rate Fell
The two lines move together on the way up and separate on the way down. From 2022 the policy rate climbed and the interest bill followed it, which is the expected relationship. Since the middle of 2024 the policy rate has fallen by 170 basis points and the interest bill has kept climbing, adding $143 billion a year over eight quarters and reaching its highest level on record.
The mechanical reason is that a government pays the rate at which each security was issued, not the rate the central bank set this morning. Debt issued cheaply in 2020 and 2021 is still maturing and being refinanced at today’s yields, which are far above what it replaced, so the average cost of the stock is still rising even as the marginal cost falls. With $39.1 trillion of federal debt outstanding, equal to 122.6 percent of annual output, that repricing takes years to work through, and the size of the stock is what makes the delay consequential rather than technical. Our examination of where $1.2 trillion of interest goes traced the same arithmetic from the budget side.
| Quarter | Federal debt | Debt as a share of output | Interest, annual rate | Interest as a share of output | Interest per person |
|---|---|---|---|---|---|
| Q4 2015 | $18.9tn | 102.6% | $435bn | 2.36% | $1,345 |
| Q4 2019 | $23.2tn | 105.8% | $564bn | 2.57% | $1,704 |
| Q1 2021 | $28.1tn | 124.0% | $534bn | 2.35% | $1,607 |
| Q1 2023 | $31.5tn | 115.6% | $861bn | 3.16% | $2,563 |
| Q1 2026 | $39.1tn | 122.6% | $1,219bn | 3.83% | $3,558 |

|
|||||
The last column is the one that converts the abstraction. In 2019 federal interest cost the equivalent of $1,704 for every person in the country. It now costs $3,558. Notice also that the interest share of output fell between 2019 and early 2021 while the debt ratio jumped by nearly twenty points, which is the same mechanism running in reverse: borrowing more at near-zero rates lowered the average cost of the stock even as the stock grew.
What the Bank for International Settlements Actually Says
The BIS treats this as a change in how monetary policy transmits rather than as a fiscal inconvenience. Its 2026 Annual Economic Report sets out two channels that a rate change opens when public debt is high, and they push in opposite directions.
The first is a transfer. Higher rates raise the government’s interest payments, and those payments go to whoever holds the bonds: pension funds, insurers, banks, foreign official institutions and households. Money moves from taxpayers to bondholders, and because bondholders spend differently from taxpayers, the aggregate effect on demand is not zero and not obviously contractionary. The second channel runs the other way. Higher rates reduce the market value of the long-dated bonds sitting on financial institutions’ balance sheets, cutting their net worth and, with it, their capacity to lend. The BIS declines to net these out, writing that the combined effects on demand and inflation “will be hard to assess.”
That refusal is the substance of the finding, and it is unusual for an institution of this kind to state so plainly that a standard relationship has become indeterminate. The received account, which our explainer on the monetary transmission mechanism sets out in its conventional form, has a rate rise cooling demand through borrowing costs and asset prices. That account is not wrong; it is incomplete once the government’s own balance sheet is large enough for the transfer channel to matter. The report adds a third concern: when bond markets malfunction and central banks step in to restore order, repeated intervention creates expectations of rescue for both investors and finance ministries, which is the moral hazard problem examined from the balance-sheet side in our piece on central bank balance sheets and fiscal policy.
The American Case Fits the Mechanism
The United States supplies an unusually clean demonstration, because two of its recent anomalies are exactly what the mechanism predicts. The first is that the Fed cut and long rates went up: as our analysis of the cuts that did not reach the mortgage market found, the ten-year Treasury and the mortgage rate stayed high while the policy rate fell. The term premium, the compensation investors demand for holding long bonds rather than rolling short ones, has moved from an average of minus 0.17 percent in 2021 to plus 0.79 in July 2026. Investors are charging more to hold duration precisely when the government needs to sell more of it.
The second is the interest bill in Figure 1, which is the transfer channel in visible form. At $1,247 billion a year, roughly 3.8 percent of national output, the payment stream is large enough to be a macroeconomic variable rather than a budget line. It is worth being clear about who receives it and who does not, because that distinction is the whole reason the channel exists. The recipients are bondholders, weighted towards institutions and towards wealthier households, and the payers are taxpayers, weighted towards the middle of the income distribution. This is not a moral claim about either group. It is the observation that a rate rise now redistributes a sum comparable to a large federal programme, and redistribution between groups with different spending patterns has demand effects that a single interest rate cannot capture.
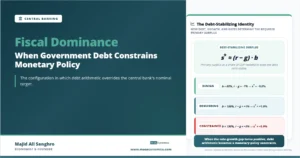
Where this ends up, if the pattern persists, is the territory described in our article on fiscal dominance: a situation in which the fiscal consequences of monetary decisions become large enough to shape those decisions. Nothing in the BIS report claims the United States is there, and neither does this article. What the report does say is that the distance has shortened, and the framework for judging how much room remains is the subject of our piece on sovereign debt sustainability.
Why This Reaches Beyond Washington
The mechanism is not American. It applies wherever public debt is large relative to output and long-dated government bonds are a significant share of what banks and insurers hold, which describes most of the rich world and a growing number of middle-income economies. What is distinctively American is scale, and the fact that Treasuries are the collateral of the global financial system. A repricing of American duration moves the discount rate applied to assets everywhere, which is why a change in the term premium in New York shows up in borrowing costs in economies whose central banks did nothing at all.
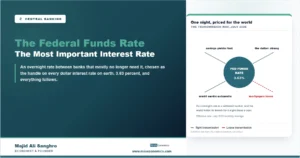
For a reader outside the United States the practical implication is that the local central bank’s decisions explain less of the local long rate than they used to. Britain has seen its gilt yields sit above Treasuries for twenty-three straight months, France pays a widening premium to Germany inside a single currency, and Japan has left two decades of near-zero yields behind. Different causes, one common feature: the price of long government debt has stopped being anchored by the policy rate in the way a generation of borrowers came to expect. Understanding what a cut can and cannot do now starts with the size of the stock it has to travel through, and the answer our explainer on the federal funds rate gives for the short end no longer carries automatically to the long one.
MASEconomics Explains
3 economic concepts behind the mechanism
These concepts are explored in depth across our educational articles library.
Conclusion
High public debt changes what a policy rate does, and the American record since 2024 shows the change rather than merely implying it. The Federal Reserve cut by 170 basis points over two years while federal interest payments rose $143 billion to a record $1,247 billion a year, because a stock of $39.1 trillion reprices as it rolls over rather than when the central bank meets. Interest now costs the equivalent of $3,558 per person, against $1,704 in 2019.
The Bank for International Settlements supplies the reason this is more than an accounting curiosity. A rate change now runs through two channels that oppose each other, transferring income to bondholders while reducing the lending capacity of the institutions holding long bonds, and the report states directly that the net effect on demand and inflation is hard to assess. That is not a prediction of any particular outcome, and this article makes none. It is a narrower and more durable point: the confidence with which a rate cut used to be described as stimulus rested on a debt stock that no longer exists, and every economy carrying a similar stock is running the same experiment.
Frequently Asked Questions
How can the interest bill rise while the Federal Reserve is cutting rates?
Because the government pays the rate set when each security was issued. Debt sold cheaply in 2020 and 2021 matures and is refinanced at today’s higher yields, so the average cost of the whole stock keeps rising even as the newest borrowing gets cheaper. With $39.1 trillion outstanding, that process takes years.
What are the two channels the BIS describes?
A rate rise increases government interest payments, transferring income to bondholders, which supports demand among that group. It simultaneously lowers the market value of long bonds held by banks and insurers, reducing their net worth and their capacity to lend, which restrains demand. The report says the combined effect is hard to assess.
Who receives the interest the government pays?
Holders of Treasury securities: pension funds, insurers, banks, mutual funds, foreign official institutions and households. Taxpayers fund the payments. Because the two groups have different incomes and different spending behaviour, moving $1,247 billion a year between them has effects that a single interest rate figure does not capture.
Does this mean rate cuts no longer work?
No. It means the size and sign of the effect are less certain than the standard account assumes, and that the long end of the yield curve responds less reliably to the short end. The conventional channels still operate; they now compete with a transfer channel large enough to matter.
Is the United States in fiscal dominance?
Neither the BIS report nor this article makes that claim. Fiscal dominance describes a state in which the fiscal consequences of monetary decisions constrain those decisions. What the evidence supports is the weaker statement that the fiscal consequences have grown large enough to enter the analysis, which was not true at a debt ratio of 100 percent.
Thanks for reading! A cut that raises the interest bill for two years running is worth understanding before the next one is described as relief. Happy learning with MASEconomics