Of the four largest rich economies, Britain currently has the lowest consumer inflation, at 2.60 percent in June 2026 against 3.46 in the United States, 2.80 in Canada and 2.73 in the euro area. It also pays the most to borrow for ten years. UK gilt yields averaged 4.80 percent that month while the American ten-year Treasury averaged 4.47, a gap of 33 basis points running the wrong way for the smaller economy with the better inflation record.
The gap itself is not the interesting part. A mid-sized economy paying more than the issuer of the world’s reserve currency is unremarkable, and for most of the past century it was the normal state of affairs. What is worth attention is that this relationship spent seven years running the other way, with Britain borrowing far more cheaply than the United States, and has now been inverted for twenty-three consecutive months without a crisis to explain it.
The Sign Flipped, Then Stayed Flipped
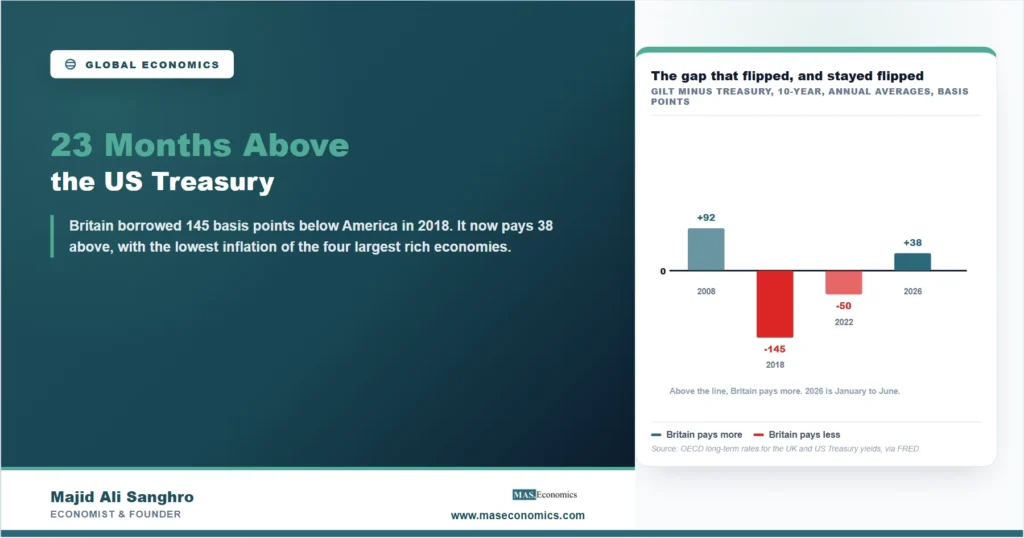
Read left to right, the chart tells a story in three parts. Through 2014 Britain paid a modest premium over the United States, widening to 92 basis points in the crisis year of 2008. Then the relationship inverted and stayed inverted for eight years. In 2018 the annual average reached minus 145 basis points, and in November of that year the ten-year gilt yielded 1.45 percent while the equivalent Treasury yielded 3.12, a discount of 166 basis points. For most of a decade, in other words, the British government borrowed long-term money more cheaply than the American government did.
The third part is recent and quiet. The gap crossed back above zero in August 2024 and has stayed there every month since, twenty-three months without interruption. That is the longest continuous run of Britain paying more than America since a sixty-eight month stretch that began in December 2006. The 2026 average so far, 38 basis points, is the highest annual figure since 2010.
Why This Gap Is Not the Clean Kind
A comparison of two government bond yields in the same currency isolates credit risk almost perfectly, which is why the euro area produces such readable spreads and why we could treat the French premium over Germany as close to a controlled experiment. A gilt against a Treasury is a different object. The two bonds pay in different currencies, under different central banks, so the gap between them contains at least three things that the OAT-Bund spread does not: expected sterling movements against the dollar, the difference between expected paths of Bank Rate and the federal funds rate, and whatever risk premium investors demand for holding currency exposure at all. Anyone claiming the 33 basis points is a pure verdict on British public finances is claiming more than the number supports, and the mechanics of that decomposition sit in our explainer on the yield curve.
What can be said with confidence is narrower and still useful. Whatever the mix, its composition changed, and it changed in a direction that costs the British Treasury money. During the years of negative spread, sterling assets were the cheaper funding, whether because expected policy rates were lower, because sterling was expected to appreciate, or both. That advantage has gone. On the way, Britain has also stopped being unusual: the Australian ten-year averaged 4.83 percent in June 2026, slightly above the gilt, and both sit well above the American figure. The repricing of long government debt has been broad, and it caught up with the reserve currency issuer last, which is a point our study of Japanese bond yields approaches from the opposite end of the same market.
Falling Inflation and a Rising Borrowing Cost, Together
The awkward fact for a simple explanation is that British inflation has been coming down while the gilt yield has been going up. Consumer inflation peaked at 3.3 percent in March 2026 and printed 2.8, 2.8 and 2.6 in the three months after, the clearest disinflation of the four economies through the same energy shock. Bond yields did the opposite: the gilt rose from 4.43 percent in February to 4.94 in May before easing to 4.80 in June.
| Month | Consumer inflation, year over year | Ten-year gilt yield | Gap over the US ten-year |
|---|---|---|---|
| January 2026 | 3.0% | 4.45% | +24 bp |
| February 2026 | 3.0% | 4.43% | +31 bp |
| March 2026 | 3.3% | 4.70% | +46 bp |
| April 2026 | 2.8% | 4.82% | +50 bp |
| May 2026 | 2.8% | 4.94% | +46 bp |
| June 2026 | 2.6% | 4.80% | +33 bp |

|
|||
Long yields are not a forecast of next month’s inflation print, so this is not a contradiction. A ten-year yield compensates a lender for average inflation over a decade, for the risk that the average turns out higher, and for tying money up that long, the last of which is the term premium. Falling current inflation reduces the first component. It does nothing for the third, and a rising term premium can more than offset an improving inflation path. That is precisely what our analysis of the Fed’s cuts and the stubborn ten-year found in the American market, where the same divergence has been running.
The consequence lands on British borrowers regardless of which explanation is right. Gilt yields anchor the pricing of corporate debt, bank funding, and mortgage products in Britain, so a government paying 33 basis points more than the American government is describing a floor under private borrowing costs, not just a line in a budget. The arithmetic of debt sustainability compounds it from the other direction, since every gilt that matures is refinanced at the new rate rather than the old one.
What the Gap Says About the Dollar
The reason a British bond yield belongs in an American reader’s field of view is that the comparison is really a statement about Treasuries. For most of the 2010s, the world paid a visible premium for the safety and liquidity of American government debt, and the mirror image was that other rich sovereigns, Britain among them, could borrow more cheaply in their own currencies. That premium has narrowed as American public debt has grown, an arithmetic examined in our piece on where $1.2 trillion of interest goes. Britain moving above the United States is one reading of that narrowing, and the broad rise in long yields across Australia, Canada, Germany and Japan is another.
None of this makes the gilt a distressed asset or the Treasury a poor one. The whole group of yields has risen together, and the ordering within it has shuffled rather than collapsed. But the ordering matters to anyone deciding where to hold long-duration savings, and it matters to finance ministries writing budgets, because the country that used to be able to count on borrowing below the American benchmark can no longer do so.
MASEconomics Explains
3 economic concepts behind the gilt-Treasury gap
These concepts are explored in depth across our educational articles library.
Explore the MASEconomics BlogConclusion
UK gilt yields at 4.80 percent against 4.47 on the American ten-year is a 33 basis point gap, and the twenty-three unbroken months behind it are what make it worth recording. Britain borrowed as much as 166 basis points below the United States in 2018 and averaged 145 below across that year. It now averages 38 above, the widest annual figure since 2010, and it has done so while running the lowest inflation of the four largest rich economies.
The honest limit of the finding is that a cross-currency yield gap mixes credit, currency and policy expectations together, so it cannot be reduced to a single verdict on British public finances. The honest content of it is that the mix changed, in a direction that raises the cost of every gilt Britain refinances and every sterling loan priced off that curve, and that the change belongs to a broader repricing of long government debt in which the United States lost an advantage rather than Britain acquiring a disadvantage.
Frequently Asked Questions
Why do gilts yield more than US Treasuries if Britain has lower inflation?
A ten-year yield compensates for average inflation over a decade, not the latest monthly print, and it also contains a term premium for tying money up and a component reflecting expected currency and policy paths. Current inflation falling reduces only one of those parts, and a rising term premium can more than offset it.
How long has the gilt yielded more than the Treasury?
Twenty-three consecutive months, from August 2024 through June 2026 on monthly averages. That is the longest unbroken run since a sixty-eight month stretch that started in December 2006. Before it, the gap had been negative for most of the period from 2015 to 2022.
Does a wider gap mean investors doubt British public finances?
It cannot be read that way on its own. The two bonds are in different currencies under different central banks, so the gap also contains expected sterling movements and the difference between expected policy rate paths. A spread within a single currency, such as France against Germany, isolates credit risk far better.
Is Britain unusual among rich economies here?
No. In June 2026 the Australian ten-year averaged 4.83 percent, slightly above the gilt at 4.80, and both were above the American 4.47. Canada, Germany and Japan were lower. The rise in long yields has been broad, and the ordering within the group has shifted rather than one country separating from it.
Who pays for a higher gilt yield?
The Treasury pays it on each gilt it refinances, so the cost builds as the existing stock rolls over rather than arriving at once. Private borrowers pay it too, because sterling corporate debt, bank funding and mortgage products are priced from the gilt curve, which makes the government’s borrowing premium a floor under everyone else’s.
Thanks for reading! A yield gap that stays open for two years without a crisis behind it is usually telling you something a crisis would have hidden. Happy learning with MASEconomics