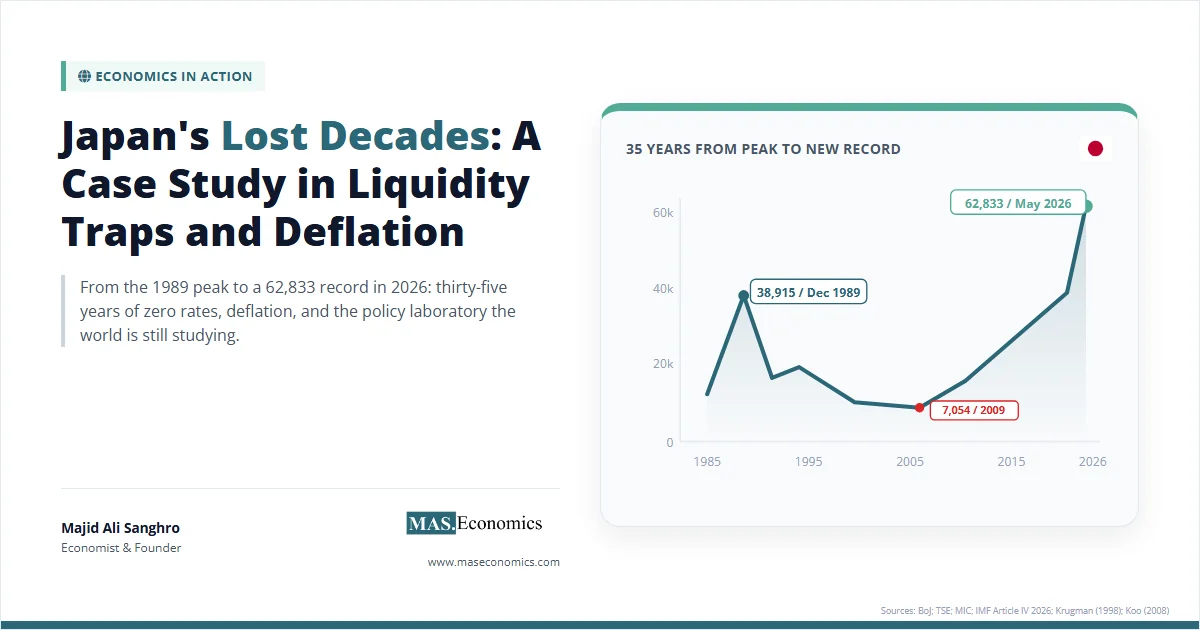
The Nikkei 225 closed at 62,833.84 on 7 May 2026, an all-time record. The same index closed at 38,915.87 on 29 December 1989 and did not return to that level until 22 February 2024, a gap of 34 years and 55 days. The benchmark is now more than 60 percent above its bubble-era peak. Japan’s nominal GDP, JPY 521 trillion in 1995, was JPY 559 trillion in 2019. Roughly flat for a quarter century. The economy grew in real terms during those years, but falling prices erased the nominal gains entirely.
Japan’s Lost Decades is the case study every macroeconomist returns to: a developed economy that hit the zero lower bound in 1995, lived in deflation for most of the next twenty-five years, ran the longest live experiment in unconventional monetary policy on record, and only began normalising rates in March 2024. By April 2026, the Bank of Japan policy rate stood at 0.75 percent, the highest level since September 1995. The episode tested every major macroeconomic framework available, and the data settled several theoretical disputes that the textbooks could not.
What follows tracks six policy phases from the Plaza Accord to the Ueda normalisation, applies the liquidity-trap, balance-sheet-recession, and demographic-headwind frameworks, and reads off the lessons that the 2008 Western crisis and the 2022 inflation surge later validated. The story is no longer one of failure alone. It is a story of failure, persistence, and a controversial exit that is still being written.
The Arc of Japan’s Crisis
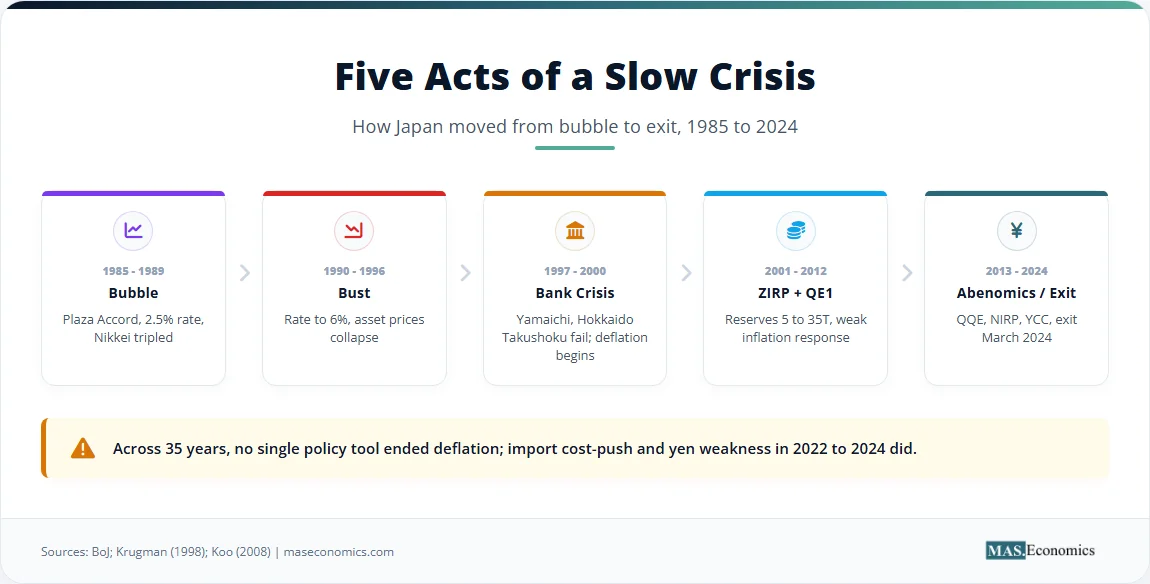
The crisis began with an unprecedented asset bubble. In September 1985, the Group of Five nations signed the Plaza Accord, coordinating a devaluation of the US dollar against the yen and the Deutsche Mark. The yen appreciated sharply, hurting Japanese export competitiveness. To offset the contractionary effect, the Bank of Japan cut the discount rate from 5.0 percent to 2.5 percent by February 1987, according to the Bank of Japan historical rate data. Cheap credit flooded the economy. Instead of funding productive capital investment, the money was poured into real estate and equities. Land prices in central Tokyo rose by a factor of four between 1985 and 1990, documented by the Japanese Ministry of Land, Infrastructure, Transport and Tourism. The Nikkei 225 tripled. Collateral values soared, banks lent more against inflated assets, and the cycle accelerated until late 1989.
The bust arrived suddenly. Yasushi Mieno, appointed BoJ Governor in December 1989, prioritised curbing speculation. The BoJ raised the discount rate from 2.5 percent to 6.0 percent by August 1990. The tightening crashed the market. The Nikkei lost 60 percent of its value by 1992. Land prices began a continuous decline that lasted through 2005. Non-performing loans accumulated in the financial system, particularly within the jusen, which were specialised housing loan corporations, and the main banks. Japanese accounting rules allowed banks to hide these losses by valuing equity holdings at historical cost rather than market value, delaying recognition of the damage. The slow recognition of bad debt is the first defining feature of the Japanese case.
Policy errors deepened the downturn. In April 1997, Prime Minister Ryutaro Hashimoto raised the consumption tax from 3 percent to 5 percent to close the fiscal deficit. The Asian Financial Crisis hit the same year. Japan tipped into a severe recession. Two major financial institutions collapsed in November 1997: Yamaichi Securities, one of the four largest brokerages, and Hokkaido Takushoku Bank, a major regional bank. The failures shattered confidence. The Consumer Price Index turned negative in 1995 and again in 1999. Deflation became entrenched and embedded in wage-setting behaviour for the next two decades.
The Bank of Japan initiated the first true quantitative easing in modern history in March 2001 under Governor Masaru Hayami. The BoJ shifted its operating target from the uncollateralised overnight call rate to the outstanding balance of current accounts held at the BoJ, targeting reserves at JPY 5 to 35 trillion. The policy expanded the monetary base dramatically but failed to generate sustained inflation. Core CPI remained near or below zero. The BoJ ended QE in March 2006, believing the recovery was self-sustaining. It was not. The 2008 global financial crisis hit Japan hard; exports collapsed, and the economy fell back into recession. The premature exit became a case study in its own right and would shape Federal Reserve thinking after 2009.
Shinzo Abe returned to the premiership in December 2012, promising “Abenomics,” a three-arrow programme of monetary easing, fiscal stimulus, and structural reform. BoJ Governor Haruhiko Kuroda launched Quantitative and Qualitative Easing in April 2013, doubling the monetary base over two years. The BoJ introduced negative interest rates in January 2016 and Yield-Curve Control in September 2016, pegging the 10-year Japanese Government Bond yield at zero percent, later allowing fluctuations within a band that widened from 0.25 percent to 0.50 percent and then to 1.0 percent. Inflation remained stubbornly below the 2 percent target until 2022, when global commodity shocks and yen weakness pushed prices higher. From 2022 through January 2026, headline inflation stayed above the BoJ target for 45 consecutive months.
The exit chapter began in March 2024 under Governor Kazuo Ueda. The BoJ ended its negative rate policy and abandoned Yield-Curve Control, raising the policy rate to 0.10 percent. A second hike in July 2024 took the rate to 0.25 percent. A January 2025 hike moved it to 0.5 percent, and a January 2026 increase brought it to 0.75 percent, the highest level since September 1995. The BoJ also began tapering its government bond purchases, reducing the monthly pace by JPY 400 billion per quarter through March 2026 and slowing to JPY 200 billion per quarter thereafter, according to the April 2026 BoJ statement. By the April 2026 meeting, three of nine board members were dissenting in favour of a rate hike to 1.0 percent, the most hawkish split of the Ueda era. The Iran conflict and surging energy prices forced the BoJ to revise its FY2026 core inflation forecast up to 2.8 percent while cutting growth to 0.5 percent, raising the prospect of mild stagflation.
The Economic Forces at Play
The persistence of deflation despite aggressive monetary expansion requires theoretical explanation. Three mechanisms explain why standard monetary policy tools failed for so long, and why the eventual escape required external shocks rather than purely domestic policy.
The Liquidity Trap Mechanism
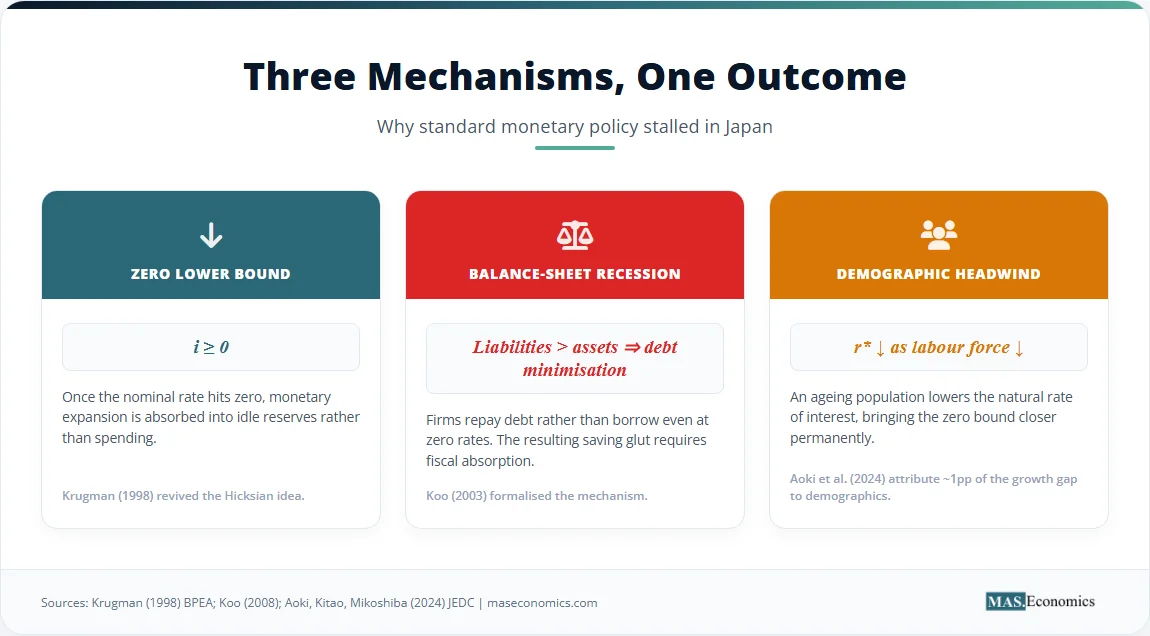
John Hicks formalised the liquidity trap in 1937 as part of his interpretation of Keynesian theory. When the nominal interest rate reaches zero, individuals and firms prefer holding cash over bonds because bonds offer no return and carry capital risk. Additional monetary expansion is absorbed into idle reserves rather than flowing into lending, spending, or asset prices. The IS-LM framework shows the LM curve becoming perfectly flat at the zero bound. Shifting it further right through reserve creation has no effect on the equilibrium interest rate or output.
Paul Krugman revived this idea in his 1998 Brookings Papers on Economic Activity essay, “It’s Baaack: Japan’s Slump and the Return of the Liquidity Trap.” Krugman argued that Japan’s problem was not a lack of liquidity but a deficiency of expected inflation. The real interest rate \( r \) is the nominal rate \( i \) minus expected inflation \( \pi^e \).
When \( i \) is at zero and expected inflation is negative, the real interest rate is positive. A positive real rate discourages borrowing and investment. To escape, the central bank must credibly commit to being irresponsible, creating expectations of future inflation that lower the real rate today. The BoJ could not manufacture that credibility on its own. It took an external shock, the global commodity price spike of 2022, combined with yen depreciation driven by BoJ policy divergence from the Federal Reserve, to break the deflation expectations that had been anchored for a generation.
Balance-Sheet Recession
Richard Koo introduced the balance-sheet recession concept in his 2003 and 2008 books. After an asset price crash, private-sector liabilities remain fixed while asset values plummet. Firms and households shift from profit maximisation to debt minimisation. They use income to repay debt rather than invest or consume, even when interest rates are zero. This collective deleveraging creates a fallacy of composition. What is prudent for one firm is disastrous for the whole economy. If everyone saves and no one borrows, the money multiplier collapses. Bank reserves do not become loans.
In a balance-sheet recession, monetary policy loses traction because there are no willing borrowers. Fiscal policy must fill the gap. Government deficits absorb the excess private savings, keeping aggregate demand afloat. Japan ran large fiscal deficits throughout the 1990s and 2000s, preventing a deeper depression but adding to the public debt, which reached 236.7 percent of GDP by 2024, according to the IMF 2026 Article IV consultation. The IMF noted that Japan’s primary deficit in 2025 was smaller than in 2019, and remarkably, nominal growth exceeding the effective interest rate has finally begun reducing the debt-to-GDP ratio. Higher inflation has done what three decades of fiscal consolidation could not.
Deflation Expectations and the Phillips Curve
Once deflation becomes the baseline expectation, the Phillips curve relationship breaks down. The New Keynesian Phillips curve links current inflation to expected future inflation and the output gap. When expected inflation is anchored near zero or negative, firms cannot raise prices without losing customers. Workers cannot demand higher wages. The curve flattens. Even a large negative output gap, meaning high unemployment and slack capacity, fails to generate the wage-price spiral that standard models predict. Japan’s core CPI remained between negative one percent and positive 0.5 percent for two decades despite repeated bouts of slack.
The 2022-2025 episode broke the pattern. Imported energy prices surged, the yen weakened past 160 to the dollar, and pass-through to domestic prices forced firms to raise prices for the first time in a generation. Spring wage negotiations, the shunto, delivered the largest pay rises since 1991, with major firms agreeing to base-pay increases of around 5 percent in 2024 and 2025. The BoJ took these wage gains as evidence that the wage-price feedback loop had finally activated. By February 2026, however, headline inflation fell to 1.3 percent, the lowest reading since March 2022, prompting questions about whether the regime change was permanent or transitory. The April 2026 reading of 1.5 percent and core CPI of 1.8 percent, still below target, kept the BoJ cautious.
Demographic Headwinds
Japan’s working-age population peaked in 1995 and has declined every year since. A shrinking labour force reduces potential output growth. Aoki, Kitao, and Mikoshiba (2024, Journal of Economic Dynamics and Control) attribute roughly one percentage point of the Japan-US growth gap to age structure. Fewer workers mean fewer consumers, less investment demand, and a lower natural rate of interest \( r^* \). As \( r^* \) falls toward zero, the central bank hits the zero lower bound more frequently, making ageing populations a structural driver of deflationary pressure. Japan’s experience suggests that the demographic headwind is not a transitory factor but a permanent shift in the macroeconomic landscape.
Policy Response Evaluation
The empirical record shows the limits of unconventional policy. The 2001 QE programme raised bank reserves, but broad money growth remained weak. QQE under Kuroda doubled the monetary base between 2013 and 2016, yet core CPI excluding the consumption tax hike effect barely reached 0.5 percent. Negative interest rates squeezed bank margins without stimulating loan demand. Yield-Curve Control suppressed long rates but distorted bond market functioning, with the BoJ owning over half of all outstanding JGBs by 2024. Inflation only arrived in 2022, driven by import cost-push from yen weakness and global commodity prices, not domestic demand. Sanae Takaichi’s election as Prime Minister in February 2026 introduced a new political dimension, with her government pushing fiscal support measures, including a temporary consumption tax suspension on food, while the BoJ resisted political pressure to delay further rate hikes.
The Numbers Behind the Story
The data reveals the depth and duration of the deflationary trap, and the scale of the recovery. The Nikkei 225 peaked at 38,915 in December 1989. By March 2009, amid the global financial crisis, it had fallen to 7,054, a loss of over 80 percent. The index spent the entire decade of the 2000s below 18,000. By May 2026, it reached 62,833, a 61 percent gain over the 1989 peak and a 791 percent gain from the 2009 trough. The recovery was driven by corporate governance reform, a weak yen supporting export earnings, and the global artificial-intelligence investment boom that lifted Japanese semiconductor and chip-equipment names like Advantest, Tokyo Electron, and SoftBank.
The CPI first turned negative year-over-year in 1995. Except for brief periods during consumption tax hike years, which produced temporary price level jumps, CPI remained at or below zero until 2021. The 2022 to 2025 inflation surge took core CPI as high as 4 percent before easing back below 2 percent in early 2026. The BoJ policy rate fell from 6.0 percent in 1990 to 0.5 percent by 1995. It reached zero in 1999. For the next 25 years, the rate never exceeded 0.5 percent. The exit, when it came, was gradual: 0.10 percent in March 2024, 0.25 percent in July 2024, 0.50 percent in January 2025, and 0.75 percent in January 2026. Each step was carefully telegraphed and accompanied by extensive market preparation.
Government debt accumulated because fiscal policy was the only effective stabiliser during the balance-sheet recession. The debt-to-GDP ratio climbed from 60 percent in 1990 to 236.7 percent in 2024. Japan was able to sustain this debt load because domestic savers, constrained by the balance-sheet recession, continued to buy JGBs at negligible yields, and the BoJ eventually purchased them in massive quantities through quantitative easing. The IMF now expects the debt ratio to decline gradually as nominal growth exceeds the effective interest rate, though it warns the trajectory will reverse from 2035 as ageing-related spending pressures build.
The Nikkei needed 34 years to reclaim its 1989 peak and now sits 60 percent above it. The policy rate broke 0.5 percent only in 2026, after 31 years below that threshold. Sources: Bank of Japan; Statistics Bureau of Japan; Tokyo Stock Exchange; IMF World Economic Outlook April 2026.
What the Japan Case Means for the Future
| Period | BoJ Governor | Policy Action | CPI Outcome (YoY) |
|---|---|---|---|
| 1985–1989 | Sumita | Rate cuts to 2.5 percent; bubble inflation | +1.2 percent to +2.4 percent |
| 1990–1994 | Mieno | Rate hikes to 6 percent; bubble burst | +3.3 percent to +0.7 percent |
| 1995–2000 | Matsushita / Hayami | Rates to zero; first ZIRP 1999 | -0.1 percent to -0.7 percent |
| 2001–2006 | Hayami / Fukui | First QE: reserve targeting | -0.7 percent to +0.3 percent |
| 2013–2022 | Kuroda | QQE, NIRP (2016), YCC (2016) | -0.1 percent to +2.5 percent |
| 2024–2026 | Ueda | Exit NIRP and YCC; rate to 0.75 percent | +2.7 percent to +1.5 percent |
 | |||
The zero lower bound is binding in practice, not just in theory. Textbook models once treated the zero bound as a remote theoretical possibility. Japan proved that a modern developed economy can hit zero and stay there for decades. The experience forced central banks worldwide to develop unconventional tools like QE and forward guidance, tools that were untested before 2001. When the 2008 financial crisis pushed the Federal Reserve to the zero bound, Ben Bernanke explicitly studied the Japanese precedent. The European Central Bank followed a similar path from 2014 to 2022. Japan’s experiment, painful as it was for Japanese households, gave the rest of the developed world a playbook.
Monetary policy alone cannot escape a balance-sheet recession. When the private sector is focused on debt repayment, increasing bank reserves does not translate into lending. Fiscal policy must absorb the resulting savings glut. Japan’s fiscal deficits were large and persistent, but they prevented a deeper collapse. The combination of high public debt and low interest rates showed that sovereign debt sustainability depends on the interest-rate-growth differential, not the absolute debt level. As the IMF noted in its 2026 Article IV review, Japan’s debt is now declining as a share of GDP precisely because nominal growth exceeds the effective interest rate, a configuration that requires positive inflation to function.
Demographic decline lowers the natural rate \( r^* \) and brings the zero bound closer permanently. As populations age and the labour force shrinks, investment demand falls relative to saving. The equilibrium real interest rate declines. Japan’s experience suggests that economies with severe demographic headwinds will spend more time at the zero lower bound, requiring permanent shifts in monetary and fiscal frameworks. Europe, China, and South Korea now face similar pressures. The global lesson is that ageing economies need higher inflation targets, more aggressive fiscal automatic stabilisers, and a willingness to accept higher debt-to-GDP ratios than the pre-2008 consensus considered safe.
Forward guidance and asset purchases work at the margin but cannot substitute for credible inflation regime change. Kuroda’s massive asset purchases expanded the BoJ balance sheet to over 130 percent of GDP, far exceeding the scale of the Federal Reserve’s interventions at peak. Yet core inflation barely moved for a decade. The BoJ could not convince the public that it would tolerate higher inflation long enough to change wage-setting behaviour. Credibility, once lost to deflation, is extremely difficult to rebuild. What finally broke the deflation mindset was not domestic policy but a combination of global commodity shocks, yen depreciation through policy divergence, and tight labour markets driven by ageing. The exit was external, not internal.
Global lessons from Japan are direct. The 2008 Western crisis followed a similar arc. Asset bubbles burst, balance sheets deteriorated, and interest rates hit zero. Lawrence Summers’ “secular stagnation” hypothesis is essentially the Japan story applied to the OECD. Europe’s experience with low inflation and negative rates from 2014 to 2022 mirrored Japan’s 1990s and 2000s. Quantitative tightening in the West carries the same risks Japan faced when it tried to exit QE prematurely in 2006. The Japan case provides the closest thing to a controlled experiment in liquidity-trap economics that macroeconomists have, and the 2026 normalisation is now part of that experiment.
MASEconomics Explains
4 economic concepts behind Japan’s Lost Decades
Conclusion
Japan’s Lost Decades constitute the longest live experiment in liquidity-trap economics on record. The episode moved through six distinct phases: an asset bubble inflated by low rates, a sharp bust triggered by tightening, a lost decade deepened by fiscal contraction and banking failures, a period of ineffective quantitative easing, a massive unconventional easing under Abenomics, and finally a normalisation under Ueda that began in March 2024 and brought the policy rate to 0.75 percent by January 2026. The theoretical frameworks of Hicks and Krugman explained the liquidity trap, Koo explained the balance-sheet mechanics that neutralised monetary policy, and demographic analysis showed how a shrinking labour force structurally lowered the natural rate of interest. The Nikkei 225 reclaimed its 1989 peak in February 2024 and reached a record 62,833.84 on 7 May 2026, while the Bank of Japan continued tapering its bond purchases and faced internal pressure for further rate hikes amid a 2.8 percent core inflation forecast for fiscal year 2026.
Did you find this article helpful? Share it with someone who loves economics. And remember, at MASEconomics, we make complex ideas simple.