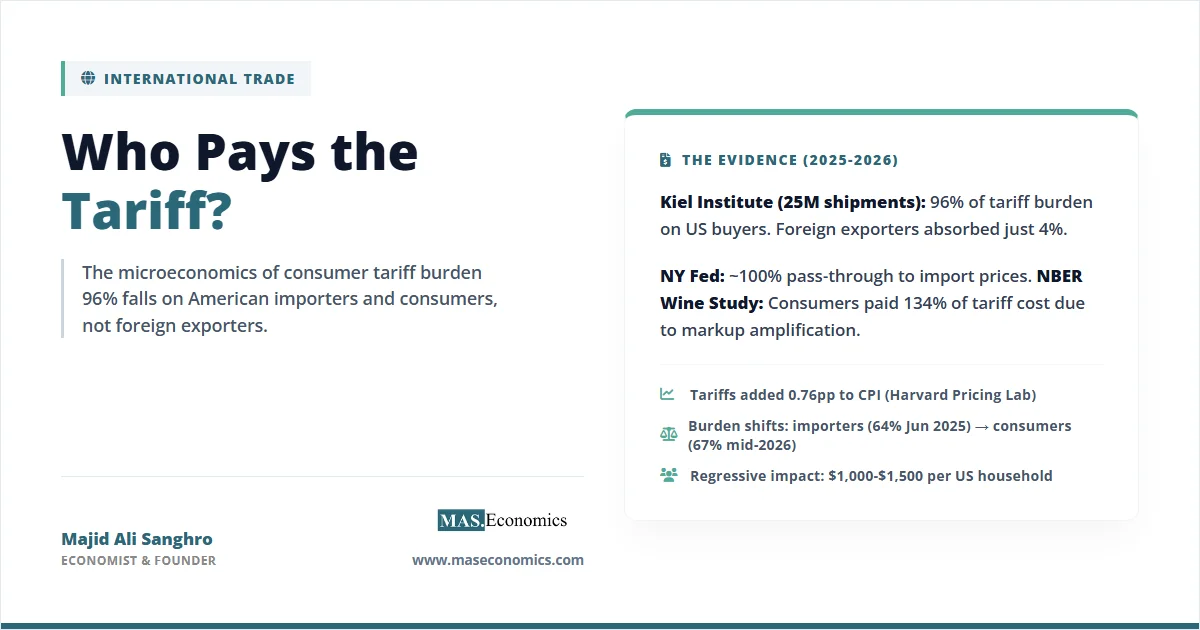
In January 2026, the Kiel Institute for the World Economy published the most granular tariff study ever conducted, analysing more than 25 million individual shipment records covering nearly $4 trillion in US imports. The finding was unambiguous: 96% of the tariff burden fell on American importers and consumers. Foreign exporters absorbed just 4%. The $200 billion surge in US customs revenue in 2025 was not wealth extracted from foreign producers. It was a transfer from American households and businesses to the US Treasury, functioning, in the researchers’ words, as “a consumption tax on imported goods.”
This is not an isolated finding. The Federal Reserve Bank of New York, using independent methodology, reached the same conclusion in February 2026: US firms and consumers continue to bear the bulk of the economic burden. A peer-reviewed NBER study tracking a single bottle of imported wine through the entire supply chain found that consumers paid 134% of the tariff cost, more than the tariff itself, because markups along the distribution chain amplified the initial price increase. The question of who pays the tariff has moved from theoretical ambiguity to empirical certainty: the importing country’s own citizens bear nearly the entire cost.
How a Tariff Moves Through the Supply Chain
A tariff is a tax on imported goods, paid at the border by the importing firm to the customs authority. The statutory obligation is clear: the US importer writes the cheque. But the economic burden, what economists call “tariff incidence,” can be distributed across three parties: the foreign exporter (through lower export prices), the domestic importer (through compressed margins), and the final consumer (through higher retail prices).
Traditional trade theory predicted that when a large country imposes tariffs, the demand reduction would force foreign exporters to lower their prices, creating a “terms-of-trade” effect where the tariff-imposing country captures some of the revenue from abroad. Under this framework, a substantial portion of the tariff cost would be borne by the foreign exporter. The theoretical expectation was that perhaps 30 to 50% of the burden would be absorbed by foreign producers.
The empirical evidence from 2018 to 2026 has decisively overturned this prediction. Study after study has found near-complete pass-through: foreign exporters did not meaningfully lower their dollar-denominated prices in response to US tariffs. The tariff incidence fell almost entirely on the US side of the transaction.
Five Studies, One Conclusion
1. The Kiel Institute Study (January 2026)
The most comprehensive analysis to date, conducted by Julian Hinz, Aaron Lohmann, Hendrik Mahlkow, and Anna Vorwig at the Kiel Institute, used daily shipment-level bill-of-lading data from Panjiva, official US Census Bureau statistics, and Indian customs records. The study examined US imports before and after the 2025 tariff escalation and conducted event studies around the unexpected tariff increases on Brazil (to 50%) and India (from 25% to 50%) in August 2025.
The core finding: 96% of the tariff cost was passed through to American buyers. Brazilian and Indian export prices to the United States did not fall following the tariff increases. When the researchers compared Indian exports to the US with shipments to Europe and Canada, there was no evidence that Indian producers lowered their prices selectively for the US market. The tariffs functioned as a pure consumption tax.
2. The New York Federal Reserve Study (February 2026)
Mary Amiti, Chris Flanagan, Sebastian Heise, and David Weinstein of the Federal Reserve Bank of New York analysed US import price data at the product level and found approximately 100% pass-through from tariffs to duty-inclusive import prices. Their conclusion: “U.S. firms and consumers continue to bear the bulk of the economic burden of the high tariffs imposed in 2025.” The authors noted that tariff-induced price increases caused firms to reorganise supply chains, but the reorganisation itself imposed additional adjustment costs without eliminating the tariff burden on remaining imports.
3. The Harvard Pricing Lab Study (Updated January 2026)
Alberto Cavallo, Ariel Llamas, and Roberto Vazquez tracked thousands of individual retail items before and after the 2025 tariffs using high-frequency scanner data. They found that retail prices of imported goods increased by approximately 6.2% relative to pre-tariff trends between March and October 2025. Domestic goods that were close substitutes rose by 3.6%, indicating that tariffs raise prices not only on imported goods but also on domestically produced alternatives, because domestic producers face less competitive pressure once import prices rise.
The study estimated that CPI, which stood at 3% in September 2025, would have been approximately 2.24% without the tariffs, a level consistent with the Federal Reserve’s target. In other words, tariffs added roughly 0.76 percentage points to headline inflation.
4. The NBER Wine Study (2026)
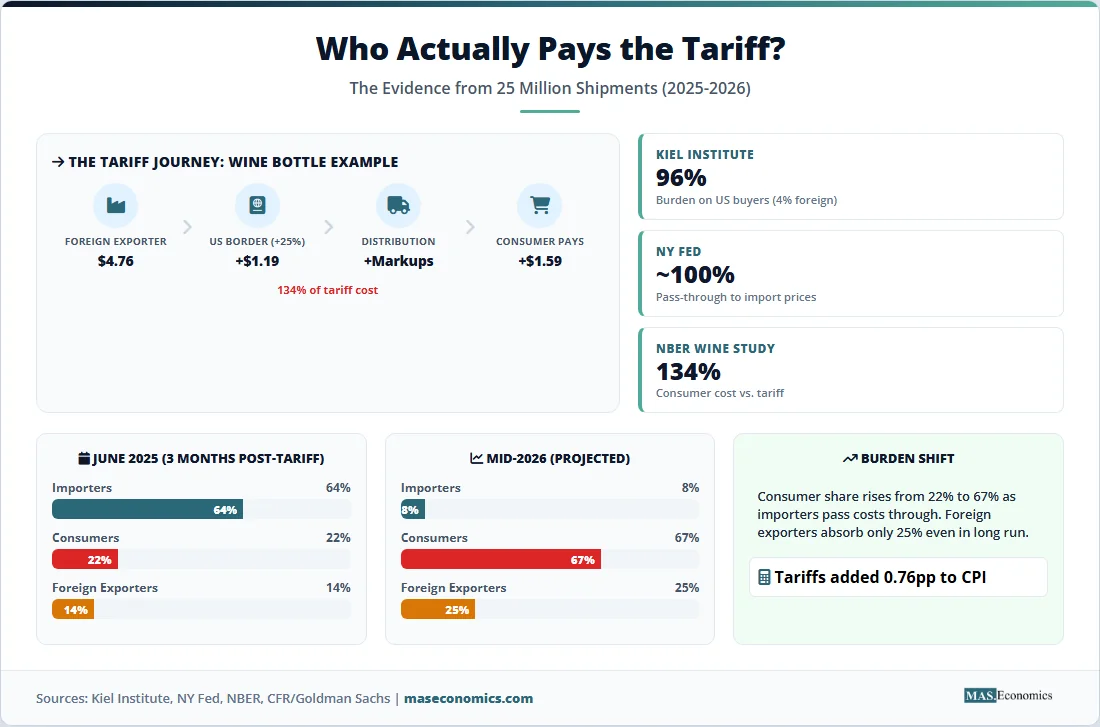
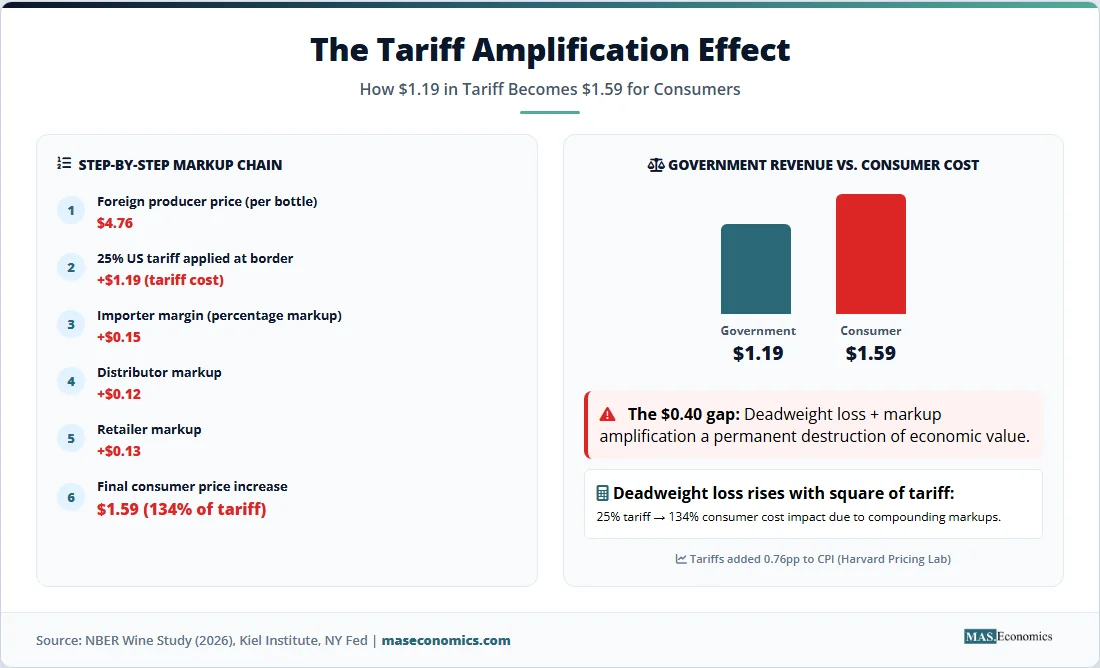
A study published by the National Bureau of Economic Research tracked a single bottle of imported wine through the entire supply chain, from the foreign producer’s gate price to the consumer’s retail checkout. The exercise revealed a critical mechanism that aggregate studies miss: markup amplification. When a 25% tariff was applied to a $4.76 bottle of wine, the government collected $1.19 per bottle. But the retail price increased by $1.59, meaning the consumer paid 134% of the tariff cost. The reason is that distributors, wholesalers, and retailers apply percentage-based markups at each stage of the supply chain. A tariff that increases the import price by $1.19 gets amplified by each successive markup into a larger retail price increase.
This finding has profound implications. It means that tariffs are even more costly to consumers than the tariff revenue they generate. The deadweight loss, the gap between consumer cost and government revenue, is not merely a theoretical concept but a measured, quantifiable burden on every transaction involving tariffed goods.
5. The CFR/Goldman Sachs Burden-Shifting Analysis (November 2025)
The Council on Foreign Relations, drawing on Goldman Sachs data and corroborated by the Yale Budget Lab, tracked how the tariff burden shifts over time among three parties: importers, foreign exporters, and consumers. In June 2025, three months after the major tariff escalation, 64% of the cost was borne by US importers (through compressed margins), 22% by consumers (through higher prices), and 14% by foreign exporters (through lower prices). By October, as importers sought alternative suppliers and retailers began passing costs forward, the consumer share had risen. The projection for mid-2026: 67% borne by consumers, 25% by foreign exporters, and just 8% by importers.
This time-varying pattern makes economic sense. In the short run, importers absorb the tariff to maintain market share. In the medium run, they pass costs through to consumers, who have limited alternatives once the tariff applies to broad categories of goods.
| Study | Data Source | Tariff Pass-Through to US | Key Finding |
|---|---|---|---|
| Kiel Institute (2026) | 25M shipment records | 96% | Foreign exporters absorbed only 4% |
| NY Fed (2026) | Product-level import prices | ~100% | Full pass-through to import prices |
| Harvard Pricing Lab (2026) | Retail scanner data | 6.2% import, 3.6% domestic | Tariffs added 0.76pp to CPI |
| NBER Wine Study (2026) | Single-product supply chain | 134% (consumers pay more than tariff) | Markup amplification along chain |
| CFR/Goldman Sachs (2025) | Aggregate burden estimates | 86% by June, rising to 92% by 2026 | Consumer share rises over time |

|
|||
Supply and Demand Determine Incidence
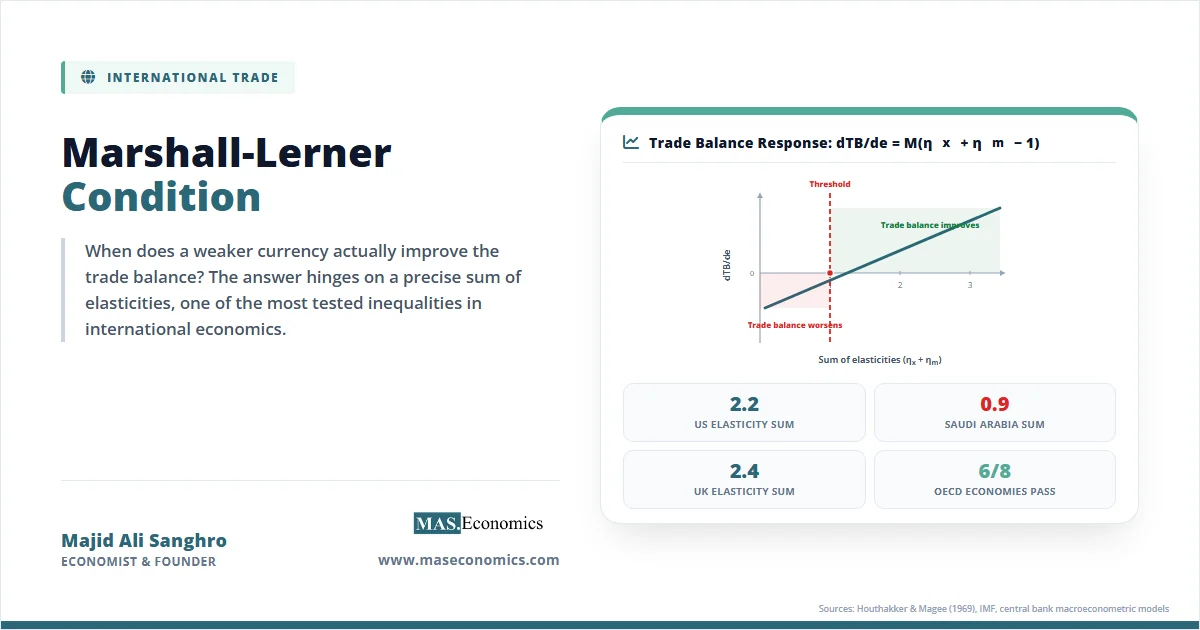
The empirical findings align with a core principle of microeconomic theory: tariff incidence depends on the relative elasticities of supply and demand. The side of the market that is less elastic (less responsive to price changes) bears a larger share of the tariff burden.
Consider a tariff of \( t \) per unit on an imported good. In a standard partial equilibrium model, the burden on consumers relative to producers depends on the ratio of supply elasticity (\( \epsilon_s \)) to demand elasticity (\( \epsilon_d \)):
When supply is highly elastic (foreign producers can easily sell to other markets or adjust production), the supply curve is flat, and nearly all the tariff is passed to consumers. When demand is inelastic (consumers have few substitutes for the imported good), the demand curve is steep, and again, consumers bear most of the burden.
Both conditions hold in many tariffed product categories. Chinese electronics manufacturers, for instance, have alternative markets in Europe, Southeast Asia, and Latin America. US consumers, meanwhile, have limited immediate alternatives for many goods, particularly where domestic production capacity does not exist. The combination of elastic foreign supply and inelastic domestic demand explains why empirical pass-through rates approach 100%, exactly as the theoretical framework predicts.
The deadweight loss from a tariff, the reduction in total economic welfare beyond the revenue collected, is given by:
where \( Q_0 \) and \( P_0 \) are the pre-tariff quantity and price. The key insight: deadweight loss rises with the square of the tariff rate. Doubling a tariff quadruples the welfare loss. This is why the escalation from a 10% tariff to a 25% tariff, or from 25% to 50% as occurred with Brazil and India in August 2025, generates disproportionately large economic damage.
Tariffs on Intermediate Goods
The economic damage from tariffs is particularly severe when they apply to intermediate goods, the components and raw materials that domestic manufacturers use to produce finished products. In 2025, tariffs on steel, aluminium, semiconductors, and industrial chemicals directly increased costs for US manufacturers that depend on these inputs.
The mechanism is straightforward. A steel tariff raises costs for every US company that uses steel: automakers, appliance manufacturers, construction firms, and infrastructure contractors. These firms face the same three choices as importers of finished goods: absorb the cost, pass it to consumers, or find alternative (typically more expensive) sources. The Tax Foundation estimates that the 2025 tariffs amounted to an average tax increase of $1,000 per US household, rising to $1,500 in 2026 including the effects of downstream price increases on domestically manufactured goods.
Research from the Peterson Institute for International Economics found that while retail prices of imported consumer goods rose by approximately 2% through July 2025, the tariff revenue on imported consumer goods as a percentage of total import value was approximately 13%. The gap between the tariff collected and the retail price increase indicates that importers initially absorbed most of the cost. But this absorption is unsustainable. As contracts are renegotiated and inventory turns over, the full tariff cost inevitably flows to consumers. The PIIE analysis concluded that US businesses had absorbed most of the tariff costs through mid-2025, but that consumer pass-through was accelerating.
Tariffs vs. Domestic Production
The stated purpose of tariffs is to protect domestic industries by making imported goods more expensive, thereby encouraging consumers to buy domestically produced alternatives. The empirical evidence on this “protection” effect is mixed at best.
The Harvard Pricing Lab study found that domestic goods that were close substitutes to tariffed imports increased in price by 3.6%, roughly 60% as much as the increase in import prices. This occurs because domestic producers, facing less competitive pressure from cheaper imports, raise their own prices. The tariff does not simply redirect spending from imports to domestic production at unchanged prices. It raises the price of all versions of the product, imported and domestic, reducing consumer surplus across the board.
Moreover, the employment effects of tariff protection in specific industries must be weighed against job losses in downstream industries that use the tariffed goods as inputs. A steel tariff that protects 10,000 steelworker jobs may cost 50,000 jobs in steel-consuming industries (auto manufacturing, construction, appliance production) because higher steel costs make those industries less competitive. Research on the 2018 steel and aluminium tariffs estimated that the cost per job saved in protected industries ranged from $600,000 to $900,000 per year, far exceeding the average wage in those industries.
Who Gets Hurt Most
Tariffs are regressive. Lower-income households spend a larger share of their income on goods, particularly consumer staples, clothing, electronics, and household products, all categories heavily affected by tariffs. Higher-income households spend a larger share on services (healthcare, education, professional services), which are largely untouched by import tariffs.
The Tax Foundation estimated that the tariffs effectively function as a flat consumption tax that falls disproportionately on the bottom three income quintiles. A household earning $40,000 per year and spending $8,000 on tariffed goods faces a larger proportional burden than a household earning $200,000 spending the same $8,000, because the tariff cost represents 20% of the first household’s income but only 4% of the second’s.
This distributional pattern is compounded by the fact that tariffs on intermediate goods raise the price of domestically manufactured products, which lower-income households are often told to buy as an alternative to imports. The “buy domestic” argument assumes domestic alternatives are available at comparable prices. In practice, tariffs raise prices for both imported and domestic versions, leaving lower-income consumers with no affordable option.
Source: CFR/Goldman Sachs (November 2025), Yale Budget Lab (July 2025), Allianz Trade (May 2025) | MASEconomics.com
The stacked bar chart reveals the time-shifting nature of tariff incidence. Immediately after tariff imposition, importers absorb the largest share (64%) because they cannot instantly renegotiate contracts or pass costs to consumers. Over the following months, the burden shifts decisively to consumers (projected at 67% by mid-2026) as importers pass through costs and retailers adjust prices. Foreign exporters absorb a modest and slowly growing share (from 14% to 25%) as their negotiating position weakens with reduced demand. The pattern confirms that tariffs function, in the medium and long run, as a consumption tax paid almost entirely by the importing country’s own population.
MASEconomics Explains
Four concepts behind the microeconomics of tariff burden
Tariff Incidence
The distribution of the economic burden of a tariff among consumers, importers, and foreign exporters. Determined by the relative elasticities of supply and demand, not by the statutory obligation (which always falls on the importer). Empirical evidence from 2018 to 2026 shows near-complete pass-through to US consumers.
Pass-Through Rate
The percentage of a tariff increase that is reflected in the price paid by the next party in the supply chain. A 100% pass-through means the tariff is added one-for-one to import prices. The Kiel Institute found 96% pass-through; the NY Fed found approximately 100%.
Deadweight Loss
The reduction in total economic welfare caused by a tariff beyond the revenue it generates. It arises because tariffs distort consumption and production decisions, causing consumers to buy less-preferred substitutes and producers to allocate resources inefficiently. Deadweight loss rises with the square of the tariff rate.
Markup Amplification
The process by which a tariff-induced price increase at the border is magnified as it passes through the distribution chain. Each intermediary (importer, distributor, retailer) applies a percentage markup, causing the final consumer price increase to exceed the tariff itself. The NBER wine study found consumers paid 134% of the tariff cost.
Conclusion
Who pays the tariff? The empirical evidence from five independent studies covering 2018 to 2026 provides a convergent answer: the importing country’s own consumers and businesses bear 96 to 100% of the cost. Foreign exporters absorb a negligible fraction, typically 4 to 14%, and this share grows only modestly over time as exporters gradually lower prices to maintain some market access. The theoretical prediction of large terms-of-trade effects, where the tariff-imposing country extracts revenue from foreign producers, has been decisively rejected by the data.
The NBER wine study adds dimension: markup amplification means consumers frequently pay more than 100% of the tariff cost, because percentage-based markups along the distribution chain compound the initial border-price increase. The Harvard Pricing Lab’s finding that domestic substitutes also rise in price (by 3.6% compared to 6.2% for imports) confirms that tariffs raise the overall price level, not just the price of imported goods.
The 2025 tariffs added approximately 0.76 percentage points to headline CPI and imposed an average cost of $1,000 to $1,500 per US household. The distributional burden is regressive, falling disproportionately on lower-income households that spend a larger share of income on goods. The deadweight loss, which rises with the square of the tariff rate, means that tariff escalation is not merely costly but exponentially so. At current tariff rates, the gap between what consumers pay and what the government collects in revenue represents a permanent destruction of economic value that benefits no one.
Did you find this article helpful? Share it with someone who loves economics. And remember, at MASEconomics, we make complex ideas simple.