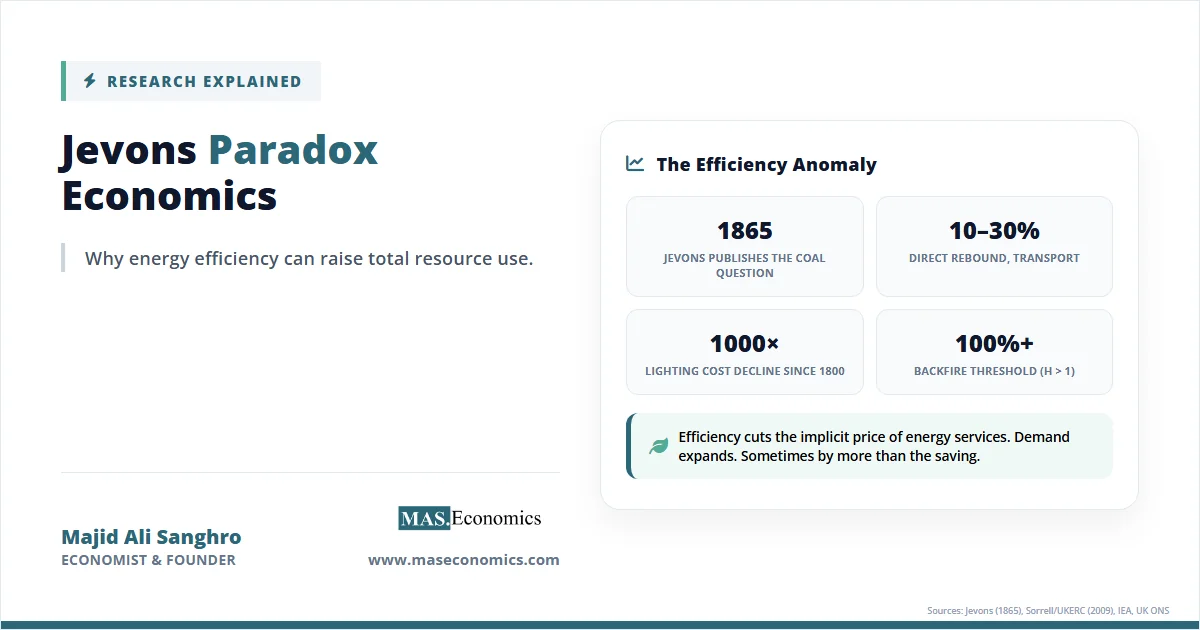
In 1865, the British economist William Stanley Jevons published The Coal Question and made an observation that contradicted the common sense of his era. James Watt’s improved steam engine used roughly one-third the coal of the older Newcomen design, yet British coal consumption had not fallen. It had multiplied many times over. Between 1830 and 1860, UK coal output rose from about 22 million tons to 80 million tons, even as the energy efficiency of steam power kept improving.
The Jevons Paradox economics framework grew out of this anomaly. The core claim is sharp: making the use of a resource more efficient does not always cut the total amount used. Often it raises it. Cheaper energy services expand the range of activities that become economically worthwhile, and the new demand can swamp the savings per unit. The mechanism is not magic. It is the standard price elasticity of demand applied to the implicit price of an energy service.
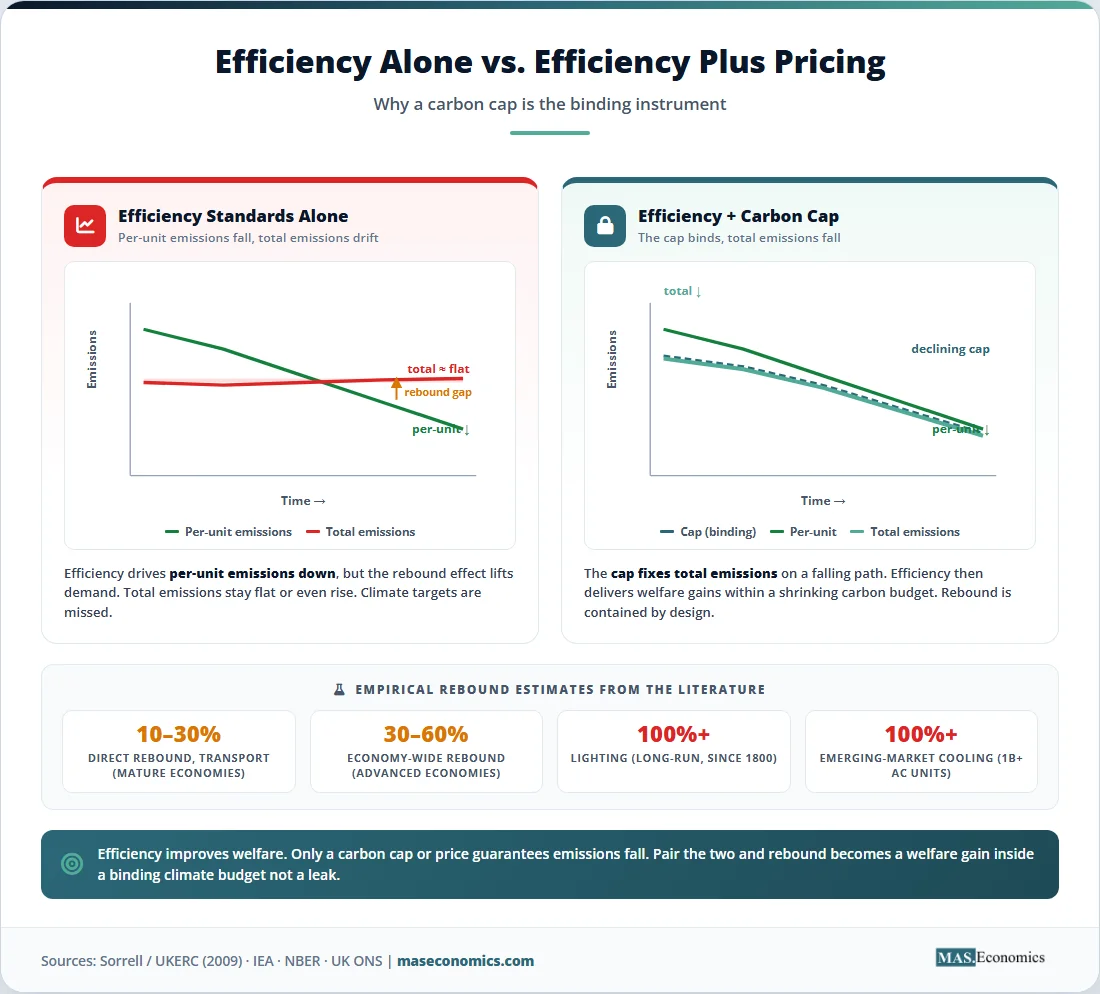
The paradox sits at the centre of climate policy debates today. If improvements in fuel economy, lighting, heating, and industrial processes can be partially or fully offset by higher demand, then efficiency mandates alone cannot deliver emissions cuts. Carbon pricing, caps, and absolute limits become the binding instruments.
The Coal Question Reframed
Jevons was writing about a strategic concern. Britain’s industrial power rested on coal, and policymakers assumed that more efficient engines would extend the country’s coal reserves. Jevons argued the opposite. Better engines lowered the cost of mechanical work. Cheaper mechanical work pulled coal into new uses: railways, ships, ironworks, textile mills, and urban gas networks. The aggregate effect was a vast expansion of coal demand, not a contraction.
The same logic applies whenever a technology lets users get more output from less input. Efficiency reduces the cost of the underlying service, and lower prices attract more buyers and more uses. The size of the demand response decides whether efficiency saves resources, partially offsets the savings, or fully reverses them.
Economists usually distinguish three outcomes. A direct rebound effect refers to the partial offset within the same activity, such as drivers covering more miles after buying a more fuel-efficient car. An indirect rebound effect captures the spending of the savings on other energy-using goods. Backfire is the strongest case, where total energy use rises after an efficiency gain, the situation Jevons described.
The original puzzle was about coal. The same mechanism now applies to electricity, natural gas, water, and even materials like steel and cement. Wherever an efficiency gain lowers the implicit price of a useful service, the demand response decides the outcome.
Jevons Paradox Mathematics
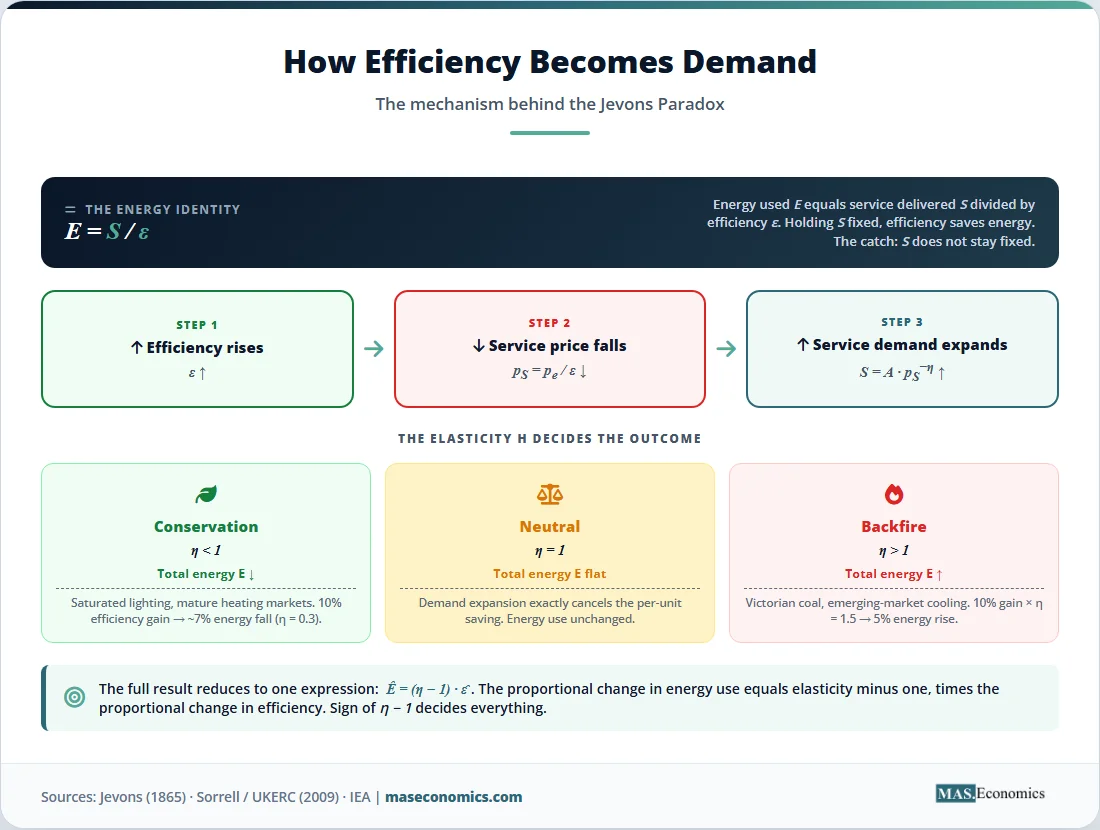
A simple framework makes the logic precise. Let \( S \) denote the energy service consumed (passenger-kilometres driven, lumens of light, hours of computing). Let \( \varepsilon \) be the efficiency of the technology, defined as the ratio of service to energy input. Then the energy used to deliver service \( S \) is:
If the price of the energy input is \( p_e \), then the implicit price of the service is:
An improvement in efficiency raises \( \varepsilon \) and lowers \( p_S \) one-for-one. The demand for the service responds to this lower price. With a constant elasticity demand function:
where \( \eta \) is the price elasticity of demand for the service and \( A \) is a scale parameter, total energy use after the efficiency change becomes:
The exponent on \( \varepsilon \) carries the entire story. If \( \eta < 1 \), demand is inelastic, and a rise in efficiency cuts energy use. If \( \eta = 1 \), demand expansion exactly cancels the per-unit saving and energy use is unchanged. If \( \eta > 1 \), the demand response is large enough that more efficient technology raises total energy consumption. This last case is a backfire, the formal version of the Jevons Paradox.
The same result can be written in growth-rate form. Let \( \hat{x} \) denote the proportional change in variable \( x \). From the energy identity:
and from the demand response \( \hat{S} = -\eta \, \hat{p}_S = \eta \, \hat{\varepsilon} \), so:
A 10 percent efficiency gain combined with an elasticity of 1.5 produces a 5 percent rise in energy use. The same gain combined with an elasticity of 0.3 produces a 7 percent fall. Empirical work on rebound therefore reduces to estimating \( \eta \) for each service in each market.
| Symbol | Meaning | Typical units |
|---|---|---|
| \( E \) | Energy input used | kWh, joules, tons of coal |
| \( S \) | Energy service delivered | passenger-km, lumens, hours |
| \( \varepsilon \) | Efficiency of conversion | service per unit of energy |
| \( p_e \) | Price of the energy input | currency per kWh or per ton |
| \( p_S \) | Implicit price of the service | currency per unit of \( S \) |
| \( \eta \) | Price elasticity of service demand | dimensionless |
| \( A \) | Demand scale parameter | dimensionless |
| \( \hat{x} \) | Proportional change in \( x \) | percentage |
 | ||
The model also separates the substitution effect from the income effect. The substitution effect captures the shift toward the cheaper service. The income effect captures the rise in real purchasing power, since users now spend less to obtain the same service and can buy more of it or of other goods. Both effects push demand up. Indirect rebound, the spending of saved money on other energy-using activities, follows from the income effect operating across the rest of the consumption bundle.
What the Model Takes for Granted
The framework rests on assumptions that hold loosely in some markets and tightly in others. Consumers and firms are assumed to respond to the implicit price of services, not to engineering claims about efficiency. They are assumed to treat the savings as real income and to allocate it across goods in line with their preferences. Preferences themselves are assumed to be stable, so the response to a price drop reflects the same demand curve before and after the technology change.
Two further assumptions matter. The first is the absence of satiation. If users already consume as much of a service as they want, additional efficiency cannot trigger much extra demand. A fully lit office gains little from cheaper lighting. A household that already keeps every room at a comfortable temperature has limited room to raise heating use after a furnace upgrade. Saturation pulls \( \eta \) toward zero and pulls outcomes toward genuine energy savings.
The second is competitive pricing in the energy market. If the price of the energy input is fixed by regulation, taxes, or rationing, then the implicit price of the service does not fall fully with efficiency, and the demand response is muted. Carbon pricing acts on this margin by holding the input price up even as efficiency improves.
The paradox is most likely where demand is far from saturation, where new uses are technically possible, and where users are price-sensitive. Emerging economies fit this description for many services. Households in low-income countries with rising incomes and unmet demand for transport, lighting, cooling, and appliances tend to expand consumption sharply when efficiency makes services cheaper. Mature economies with saturated demand for basic services tend to show a smaller rebound, often well below 100 percent.
The model also abstracts from general-equilibrium effects. When efficiency rises across an entire sector, the freed-up labour, capital, and energy flow into other sectors and may raise output and energy use there. Economy-wide rebound estimates that account for these spillovers tend to be larger than the direct rebound at the level of the individual user.
Empirical Evidence on Rebound
The historical record begins with Jevons’s own data. UK coal output rose from roughly 16 million tons in 1815 to about 110 million tons by 1865 and exceeded 270 million tons by 1900. Across the same century, the thermal efficiency of steam engines improved from around 1 percent in early Newcomen designs to more than 15 percent in late-Victorian compound engines. Efficiency rose roughly fifteen-fold while consumption rose more than ten-fold, the textbook signature of backfire driven by the spread of steam to ever more uses.
Modern transport gives the most studied case. Reviews of the direct rebound effect for car travel estimate elasticities of around 10 to 30 percent in mature economies. A 10 percent improvement in fuel economy raises driving by roughly 1 to 3 percent, eating into but not erasing the energy savings. The International Energy Agency and the UK Energy Research Centre’s 2007 report by Steve Sorrell document this range across multiple studies.
Lighting provides the cleanest case of long-run backfire. Work by Tsao and others traces the cost of artificial light from candles through gas lamps, incandescent bulbs, fluorescents, and LEDs. The energy needed to produce one lumen-hour has fallen by roughly a factor of one thousand since 1800. Spending on lighting as a share of GDP has stayed in a narrow band. Light consumption has expanded so much that total energy used for illumination has continued to grow over the long run, even though every individual technology was more efficient than the one it replaced.
Industrial energy use shows mixed results. The UK Office for National Statistics tracks energy intensity, the ratio of energy used to GDP. Energy intensity in advanced economies has fallen steadily for decades, yet absolute energy use has risen in most of them, with declines only since the late 2000s and only in some sectors. Decomposition studies typically find that efficiency gains explain a large share of the intensity decline, while structural shifts toward services and rebound effects partially offset the savings.
Air conditioning illustrates the income channel. As cooling units became more efficient and electricity prices fell in real terms, ownership rates surged across emerging Asia. China alone added more than a billion air-conditioning units between 2000 and 2020. Each new unit was more efficient than its predecessors, yet sectoral electricity demand grew sharply. The IEA’s Future of Cooling report projects that cooling demand in emerging markets will continue to outpace efficiency gains for decades.
Figure 1. UK coal output and steam engine thermal efficiency, 1800–1900. Both rose together for a century, the signature pattern of backfire. Sources: Mitchell, British Historical Statistics; Smil, Energy in World History; UK ONS historical series.
The empirical literature converges on a graded view. Pure backfire, where rebound exceeds 100 percent, is rare in mature markets for established services but common over long historical horizons and in fast-growing emerging economies. A rebound in the 10 to 30 percent range is typical for direct effects in advanced economies. Economy-wide rebound, including indirect and general-equilibrium effects, is often estimated between 30 and 60 percent, with wider bands in the literature. The exact figure depends on the service, the market, and the time horizon, but the rebound is almost never zero.
Why Jevons Still Shapes Policy
The policy implications are immediate. If efficiency mandates trigger a rebound of even 30 percent, then a regulation projected to cut energy use by 10 percent will deliver only 7 percent in practice. If rebound exceeds 100 percent, the policy raises emissions instead of cutting them. Governments that rely on fuel-economy standards, appliance labels, and building codes alone will miss climate targets even when each individual standard is met.
The corollary is that efficiency policy needs a complement that fixes the price of the energy input. Carbon pricing, whether through a tax or a cap-and-trade system, holds \( p_e \) high enough that improvements in \( \varepsilon \) do not collapse \( p_S \) all the way down. Rebound shrinks because the implicit price of the service falls less, and the absolute cap on emissions, where one exists, ensures that any rebound elsewhere comes out of the same fixed budget. The European Union’s emissions trading system illustrates this combination: efficiency standards push down per-unit emissions, while the cap holds total emissions to a declining ceiling.
The argument links to the broader theory of market failure and externalities. The reason households and firms undervalue energy savings is not only myopia or split incentives. It is the absence of a price on the carbon released. Once the externality is internalised, efficiency and conservation become substitutes that work together rather than levers pulled in isolation. The Coase Theorem applies in narrow settings, but for a global pollutant with billions of emitters, transaction costs are too large for private bargains to deliver the efficient outcome. Pigouvian instruments are a workable tool.
The United Kingdom’s experience with domestic energy efficiency between 2004 and 2020 shows the limits of supply-side measures. Insulation grants, condensing boiler mandates, and lighting standards reduced household energy intensity sharply. Total household energy consumption fell more slowly than projected, partly because warmer indoor temperatures and larger heated floor areas absorbed some of the savings. The Climate Change Committee’s monitoring reports treat the gap as evidence that efficiency policy needs to be paired with carbon pricing on heating fuels, a step the UK has begun through its Emissions Trading Scheme.
The United States offers a parallel case in transport. Corporate Average Fuel Economy standards have raised the fuel economy of new vehicles by roughly 50 percent since 1980. Vehicle miles travelled have grown faster than the population, eroding part of the savings. Studies by the National Bureau of Economic Research and the Department of Transportation place the direct rebound effect for US driving at around 10 to 25 percent. Combined with population growth and the rise of light trucks, the net result is that gasoline consumption fell only modestly through the 2010s despite large efficiency gains.
Canada and Australia face a sharper version of the same dilemma. Both countries have low population density, high per-capita energy use, and long-distance transport patterns that magnify rebound for fuel economy improvements. Their climate strategies increasingly combine efficiency standards with carbon pricing. Canada’s federal carbon pricing benchmark and Australia’s safeguard mechanism for large emitters operate alongside fuel and appliance standards, recognising that efficiency alone cannot deliver national emissions targets.
The link to growth and development matters too. Efficiency that triggers a rebound is not waste. It expands access to lighting, mobility, cooling, and computing. Hundreds of millions of people in economies adapting to climate change need more energy services, not fewer. Efficiency lowers the cost of those services, which is welfare-improving even when total energy use rises. The policy task is to decouple welfare gains from carbon emissions, which efficiency cannot do on its own. Pricing the externality and capping aggregate emissions does the decoupling. Efficiency then delivers welfare gains within a falling carbon budget. This is the central insight that green macroeconomics formalises into the design of fiscal and monetary frameworks.
The Jevons Paradox also recasts the popular green-growth narrative. Decoupling GDP from energy use is possible in principle, and several advanced economies have achieved relative decoupling, where GDP grows faster than energy use. Absolute decoupling, where energy use falls while GDP rises, is harder and has happened only in specific places and periods, often during deindustrialisation. The honest reading of the evidence is that efficiency and structural shifts can deliver relative decoupling reliably and absolute decoupling sometimes, but neither is automatic and neither is sufficient for climate targets without additional pricing or regulatory force.
For sectors where the rebound is small, efficiency policy works on its own terms. Refrigeration in saturated markets, industrial processes with little room for output expansion, and lighting in fully lit spaces are examples. For sectors where rebound is large, especially transport, heating in cold climates, and cooling in hot ones, efficiency needs partner instruments. The policy mix should match the elasticity of each service rather than assuming a single instrument fits all.
Standards also have a political-economy advantage that pricing lacks. They face less visible opposition because their cost is bundled into product prices, while carbon taxes are salient and unpopular. The result in many democracies has been a heavier reliance on standards than economic theory recommends. The Jevons Paradox argues for rebalancing toward pricing, while keeping standards for cases where information failures or split incentives prevent users from responding to prices alone.
MASEconomics Explains
Four economic concepts behind the Jevons Paradox
Conclusion
Jevons Paradox economics shows that efficiency gains lower the implicit price of energy services and trigger demand responses that can offset, neutralise, or reverse the underlying savings. The size of the response depends on the price elasticity of the service. Empirical work places direct rebound for transport at roughly 10 to 30 percent, identifies long-run backfire in lighting, and documents a large rebound in emerging-economy cooling and appliance markets. UK coal in the nineteenth century remains the canonical case of full backfire, with consumption rising tenfold as efficiency rose fifteenfold. Climate policy that relies on efficiency standards alone underestimates emissions because it ignores this demand response. Carbon pricing and absolute caps close the gap by holding the input price up and fixing the total quantity of emissions, leaving efficiency to deliver welfare gains within a binding budget rather than substituting for the budget itself.
Did you find this article helpful? Share it with someone who loves economics. And remember, at MASEconomics, we make complex ideas simple.