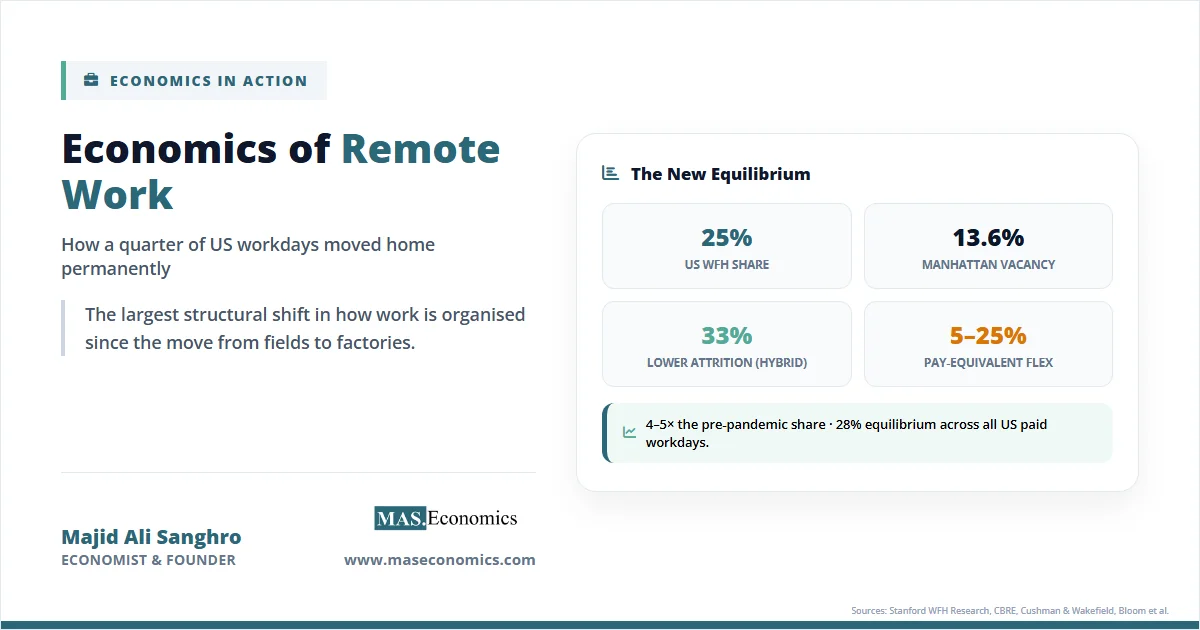
The economics of remote work is now the central question in labour markets. Roughly a quarter of paid workdays in the United States are performed at home, four to five times the pre-pandemic share. Manhattan office vacancy ended 2025 at 13.6%, while Sydney’s CBD vacancy hit 13.8%, the highest in three decades. Tuesday and Thursday have become the new “office days” for tens of millions of workers. The geography of work has been redrawn.
This is the largest structural shift in how work is organised since the move from fields to factories. Remote work is not a perk or a phase. It is a permanent change in production technology that is rewriting wages, rents, tax bases, and the spatial pattern of cities. The economics of remote work sits at the intersection of labour economics, urban economics, and real estate finance.
The 28% Remote Work Equilibrium
Stanford’s WFH Research project, led by Nicholas Bloom, José María Barrero, and Steven J. Davis, tracks remote work using three independent data streams: surveys, building badge swipes, and cell-phone location data. All three converge on the same number. Around 25 to 28% of paid full workdays in the United States are now done from home. Before the pandemic, that share was 5 to 7%.
The shift settled fast. Remote work peaked above 60% during the spring 2020 lockdowns, fell back to 30% by late 2022, and has stayed near 25% ever since. Headlines about return-to-office mandates have not moved the trend. Stanford research finds that even aggressive RTO mandates would lower the work-from-home share by only about 0.5 percentage points across the US economy.
How Remote Work Became Permanent
The transition happened in three phases. The 2020 forced experiment proved the technology worked for any task that did not require physical presence. The 2021–2023 negotiation period saw firms test mandates and employees push back. Since 2024, hybrid has stabilised as the dominant model for knowledge work, with around 52% of remote-capable workers splitting time between home and office, 27% fully remote, and 21% fully on-site.
The lockdown phase was the largest natural experiment in labour economics ever conducted. Within weeks, more than 60% of US paid workdays moved out of offices. Capital expenditure on home offices surged. Zoom’s daily meeting participants jumped from 10 million in December 2019 to over 300 million by April 2020. Investment in the digital infrastructure of remote work, once made, did not disappear when offices reopened. That sunk cost in software, monitors, ergonomic chairs, and management practices became the foundation of the new equilibrium.
The 2022–2023 negotiation phase exposed a clear gap between executives and workers. KPMG surveys showed nearly two-thirds of CEOs expect a full return to the office by 2026. Cell-phone tracking and badge-swipe data tell a different story. Despite high-profile mandates from JPMorgan, Amazon, Disney, and Goldman Sachs, the actual remote work share rose between late 2022 and early 2025. Workers who could not get flexibility from their employer often found another one. University of Pittsburgh research on RTO mandates finds that they hurt job satisfaction without measurably improving business performance, and roughly eight in ten companies that imposed mandates lost talent in the following year.
The timeline below tracks the key inflection points that shaped the current equilibrium.
| Period | Event | Economic Significance |
|---|---|---|
| March–April 2020 | Global lockdowns force office workers home | Remote share jumps from 5% to 60% of US workdays in eight weeks. |
| 2021 | Tech firms announce permanent flexibility | Spotify, Twitter, and Meta endorse “work from anywhere,” anchoring expectations. |
| Late 2022 | First wave of RTO mandates from JPMorgan, Disney, Amazon | National telework rate dips to 17.9%, then rebounds. |
| 2023 | Tech sector layoffs across Meta, Google, Amazon, Microsoft | Office sublease space hits record highs in San Francisco and Seattle. |
| June 2024 | Bloom et al. Trip.com study published in Nature | Randomised trial of 1,612 workers shows hybrid lowers attrition 33% with zero productivity loss. |
| 2025 | US federal RTO mandate; UK and Canadian banks tighten policies | Federal hybrid share drops from 61% to 28%; private-sector remote work holds steady. |
| Q1 2026 | Hybrid equilibrium confirmed; AI leasing surges in Manhattan | US WFH share at 25%; AI firms drive flight-to-quality in top-tier offices. |

| ||
What looked like a temporary shock in 2020 turned into a structural reset. The investment in home offices, video infrastructure, and management practices created a one-way ratchet. Once firms learned that remote work was feasible at scale, the equilibrium moved permanently.
Economic Drivers of Remote Work
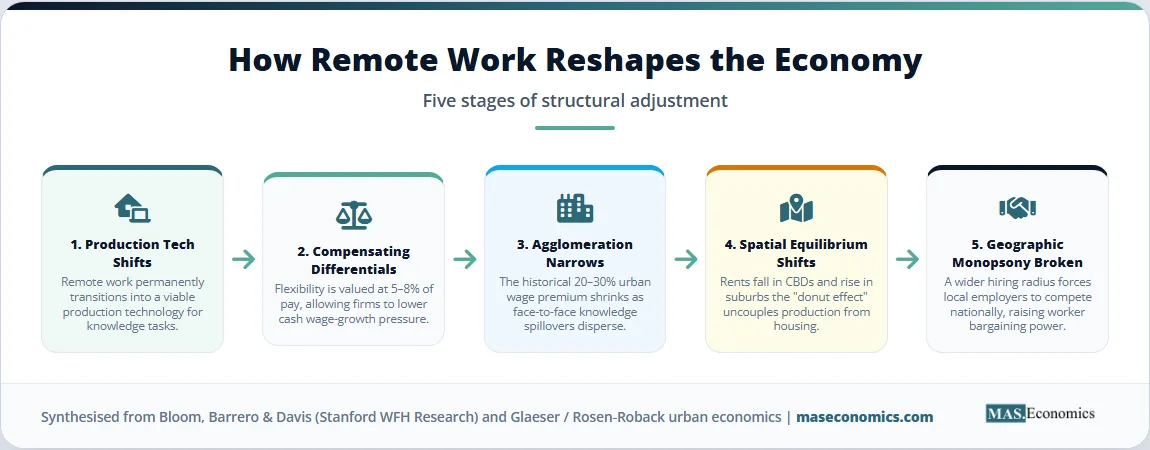
Three branches of economic theory help explain why remote work persists: productivity theory, urban economics, and labour market analysis. Each branch points to a different distributional outcome.
Productivity and Compensating Differentials
The simplest economic question is whether remote work raises or lowers output. The most rigorous answer comes from a randomised controlled trial run by Nicholas Bloom and co-authors at Trip.com, the world’s largest online travel agency. Workers were randomly assigned to either five days in the office or two days at home. After six months, output, code quality, and promotion rates were identical across both groups. Resignations fell 33% in the hybrid group.
The productivity result is not magic. It reflects a tradeoff. Remote workers save commute time, take fewer sick days, and face fewer interruptions. They also lose some informal mentoring, face-to-face problem-solving, and team cohesion. For most knowledge tasks, the gains and losses roughly cancel. McKinsey research finds that well-coordinated hybrid teams are about 5% more productive than fully on-site teams, while poorly coordinated arrangements suffer from a “coordination tax” as schedules drift apart.
The bigger lever is compensation. The theory of compensating differentials, developed by Adam Smith and formalised by Sherwin Rosen, says that workers accept lower pay for jobs with non-wage benefits. Bloom and co-authors estimate that the average worker would give up about 5% of salary to keep two or three days of remote work. Harvard’s Zoë Cullen finds that tech workers would sacrifice up to 25% of compensation to avoid a five-day commute. At an average tech salary of $239,000, that is nearly $60,000 in implicit value per worker. The future of work is being repriced in the form of flexibility, not wages.
This repricing has wage-setting consequences. If workers value flexibility at 5–8% of pay, firms that offer it can hire equivalent talent for 5–8% less in cash compensation. The Atlanta Fed’s CES survey, run by Barrero, Bloom, Davis, and Meyer, finds that the shift to remote work has lowered wage-growth pressure by an estimated 2 percentage points cumulatively since 2020.
Cities and Agglomeration
Urban economics is built on the principle of agglomeration. Cities exist because density makes workers and firms more productive: ideas spill over, supply chains thicken, and labour markets match more efficiently. Edward Glaeser and Joshua Gottlieb call this the “consumer city” effect when amenities are added in. The wage premium for working in a dense city has historically been around 20–30% compared with rural areas.
Remote work breaks the link between where production happens and where people live. The “donut effect,” documented by Arjun Ramani and Nicholas Bloom in 2022, shows that during the pandemic, demand for housing fell in central business districts and rose in suburbs and exurbs of the same metros. New York, San Francisco, and London saw urban rents drop 5–15% while suburban rents jumped. The pattern was strongest in cities with the highest pre-pandemic density premium.
Spatial equilibrium, Rosen and Roback’s framework for understanding city size, predicts that wages, rents, and amenities adjust until workers are indifferent across locations. Remote work shifts that equilibrium. If a worker can earn a Manhattan salary while paying Cleveland rents, the relative price of living in Manhattan must fall, the relative price of living in Cleveland must rise, or wages must compress across cities. All three have happened. Median rent in the New York metro fell 4% in real terms between 2019 and 2024, while Boise, Austin, and Phoenix saw real rent increases of 25% or more.
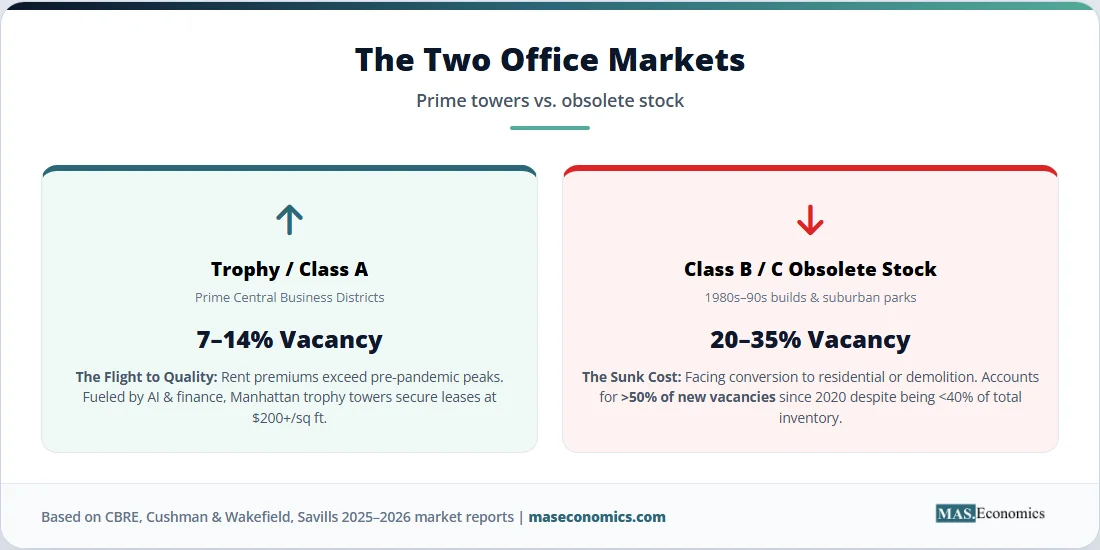
The biggest losers are commercial real estate landlords in older Class B and C buildings. Brookfield’s analysis shows that offices built in the 1980s and 1990s account for more than half of new vacancies since 2020, despite making up under 40% of the inventory. Trophy buildings have actually tightened. New York saw more leases at $200 per square foot signed since 2020 than in the previous five years combined. The flight-to-quality is brutal. Housing affordability in mid-tier cities has worsened as remote workers spread the urban wage premium across a wider geography.
Labour Market Power and Skill Matching
Remote work also alters bargaining power. Monopsony theory, revived by Alan Manning and David Card, says that local labour markets are often dominated by a small number of employers, allowing them to pay below competitive wages. Remote work breaks the geographic basis of monopsony. A software engineer in Tulsa now competes with workers in Bangalore, Buenos Aires, and Berlin. A programmer in Manhattan can take a job from a firm in Austin without moving.
The distributional effects cut both ways. Workers in high-amenity, high-cost cities lose the geographic premium that protected their wages. Workers in lower-cost regions gain access to higher-paying remote roles. Globally, occupations that can be performed remotely face new competition from talent pools in lower-wage countries. Economics of the gig economy has documented similar dynamics for platform-based work, and remote knowledge work is now exhibiting the same compression at the high end of the wage distribution.
Skill-task matching becomes thinner geographically and thicker across firms. The University of Chicago’s Steven Davis finds that remote-capable job postings rose from 2.5% of OECD ads in January 2020 to about 11% by 2024. Hiring radius has expanded by an average of 80 kilometres for hybrid roles and is essentially national for fully remote roles. Jobs reports and labour market data show that workers with bachelor’s degrees telework at 37.6%, while those with high school diplomas sit at 9.1%. The benefits are heavily concentrated among college-educated workers in professional services, finance, and technology.
The opposite end of the labour market has felt different pressures. Workers in healthcare, retail, hospitality, and manufacturing cannot work remotely. The flexibility premium they cannot capture has translated into wage compression at the bottom of the distribution, partly through the “unexpected compression” that Autor, Dube, and McGrew document in low-wage labour markets between 2020 and 2023. Some of that compression is real wage convergence. Some of it reflects the fact that remote-capable workers absorbed flexibility benefits as compensation, which lowered their cash wage growth and narrowed the apparent gap.
Distributional effects spill into city finances. New York City’s office buildings contribute about 20% of the property tax levy. Persistent vacancy in older buildings reduces assessments and pressures budgets. Transit systems built for five-day commuting see ridership stuck at 70–80% of pre-pandemic levels in most US cities, forcing fare hikes or subsidy increases. Local retail, restaurants, and service businesses near central business districts have lost foot traffic on Mondays and Fridays, accelerating consolidation. Platform economics companies that match workers to flexible spaces have grown on the back of this dispersion.
Remote Work by the Numbers
The data points to a stable hybrid equilibrium with sharp variation across cities and asset classes. The chart below traces the share of US paid workdays performed remotely from 2019 to 2026.
Source: WFH Research / Stanford SIEPR (Barrero, Bloom & Davis); Bureau of Labor Statistics. Annual averages of monthly survey data.
The plateau since 2023 is the central fact. Despite high-profile mandates and macro turbulence, remote work has not retreated. Office vacancy patterns confirm the same story but with sharp city-level differences.
| City | Vacancy Rate | Pre-Pandemic Norm | Pattern |
|---|---|---|---|
| Manhattan, New York | 13.6% (Dec 2025) | ~8% | Recovering fast on AI and finance leasing. |
| London (City) | 7.0% (Q4 2025) | ~5% | Tight in core, weak in fringe (Hammersmith 26%). |
| Toronto (Downtown) | 14.4% (Q1 2026) | ~3% | Falling on big-bank RTO mandates and conversions. |
| Sydney (CBD) | 13.8% (Jan 2026) | ~5% | Highest in 31 years; prime tighter than secondary. |
| San Francisco | 25.2% (Q4 2025) | ~7% | Worst of any major US market; tech-led oversupply. |
| US National | 18.7% (Q1 2026) | ~9–10% | Plateauing; Class A absorption positive. |
|
| |||
Sources: CBRE Global Prime Office Rent Tracker, Cushman & Wakefield U.S. MarketBeat Q1 2026, Savills Central London Office Market Watch, Property Council of Australia, CBRE Canada.
The productivity studies tell a similarly mixed but converging picture.
Source: Bloom et al. (Nature 2024), Bloom Liang Roberts Ying (QJE 2015), Stanford WFH Research, McKinsey 2024 hybrid productivity surveys, Emanuel Harrington Pallais NBER WP 31880.
The studies converge on the same conclusion: well-managed hybrid work has a productivity effect close to zero, sometimes mildly positive. The earliest call-centre evidence from China showed gains of 13% from full work-from-home, but those tasks were highly individual. In team-heavy knowledge work, gains and losses balance. The productivity debate is largely settled. The remaining debates are about culture, mentoring, and innovation, which are real but harder to measure.
What Remote Work Means for the Future
Three lessons stand out for the future of cities and labour markets.
First, cities are not dying, but their function is changing. Manhattan’s recovery shows that prime urban locations remain magnets for high-value activity, especially AI, finance, and law. Q1 2026 Manhattan leasing volume hit nearly 9 million square feet, with AI firms alone leasing 415,000 square feet, half as much in three months as they leased in all of 2025. American Express signed a two-million-square-foot lease at 2 World Trade. The donut effect has thinned but not collapsed central business districts. What has died is the assumption that every office worker must commute five days a week. Cities now compete on amenities, dynamism, and quality of life, not on captive labour markets. Mid-tier cities and suburbs that invested in walkable downtowns, broadband, and good schools have captured a permanent share of the knowledge worker population.
Second, broadband and digital infrastructure have become public goods on the scale of roads or electricity grids. The pandemic exposed a digital divide that mapped onto pre-existing income and geographic inequalities. Workers with reliable home broadband and a quiet workspace gained access to a labour market the size of a continent. Those without lost ground. The economics of data and digital trade show how cross-border information flows now drive economic activity that used to require physical proximity. Public investment in last-mile fibre, rural connectivity, and digital skills training has higher returns than at any point in the past 50 years. The OECD estimates that closing the rural-urban broadband gap in advanced economies would add 0.5 to 1.5 percentage points to GDP growth over a decade.
Third, technology has limits. Remote work is dominant for individual production tasks. It is weaker for early-career mentoring, complex creative work, and the kind of tacit knowledge transfer that happens in hallways. NBER research by Emanuel, Harrington, and Pallais finds that junior software engineers learn faster from senior peers when they sit nearby. A separate Nature study by Brucks and Levav finds that virtual brainstorming generates fewer creative ideas than in-person sessions, although it produces equivalent quality once an idea is selected. That is why hybrid, not full remote, has become the equilibrium. Firms want the productivity of focused individual work and the culture of shared physical space. The optimal mix is not five days, not zero days, but two or three days in the office, coordinated across teams.
The next frontier for the economics of remote work is the global labour market. As remote-capable jobs become geographically untethered, the wage compression that happened within countries will start to happen across them. Stanford’s Global Survey of Working Arrangements covers 22 countries and finds that English-speaking economies sit at the top of remote work adoption, while parts of Asia remain low. The next decade will test whether high-wage economies can hold the cost premium when comparable work can be done in lower-cost regions. The answer will shape immigration policy, trade policy, and the geography of inequality for a generation.
MASEconomics Explains
Four economic concepts behind the economics of remote work
Conclusion
The economics of remote work has settled into a stable hybrid equilibrium at roughly a quarter of US paid workdays, four to five times the pre-pandemic share. Office vacancy in major global CBDs ranges from 7% in central London to 25% in San Francisco, with a sharp split between trophy buildings and obsolete stock. Productivity research from Bloom, Barrero, Davis, and McKinsey converges on a near-zero net effect for well-managed hybrid arrangements, with retention and worker welfare gains. Compensating differentials value flexibility at 5–8% of pay for the average worker and up to 25% for tech workers, lowering wage-growth pressure. Agglomeration externalities have weakened but not vanished, the urban wage premium has narrowed, and labour market bargaining power has shifted toward remote-capable skilled workers and away from low-amenity employers. Commercial real estate, transit systems, and central-city tax bases have absorbed the largest losses, while suburbs, mid-tier cities, and digital infrastructure providers have gained.
Did you find this article helpful? Share it with someone who loves economics. And remember, at MASEconomics, we make complex ideas simple.