In June 2022, headline US CPI peaked at 9.1 percent year-on-year while core CPI sat at 5.9 percent. The 3.2-percentage-point gap was the widest since 1980, and it forced every Fed watcher to ask the same question that the Federal Open Market Committee asks every month. Core CPI explained means stripping food and energy out of the consumer price index to isolate the underlying trend that monetary policy can actually influence.
The Bureau of Labor Statistics publishes both the headline CPI-U and the core measure (CPI-U ex food and energy) in the same monthly release. The two move together over the years, but month-to-month, the gap can be wide enough to flip the policy signal. Reading the two correctly is the foundation for interpreting every CPI release and every Fed press conference.
Why the Fed Looks Through Food and Energy
Core CPI removes two basket categories that carry roughly 21 percent of the all-items weight: food (about 13.5 percent) and energy (about 6.8 percent in 2024 weights). The exclusion is not a judgment about whether food and energy matter to household budgets. Both matter enormously. The exclusion is a statistical decision about which prices contain a stable signal about underlying inflation.
The original argument goes back to Robert Gordon’s work in the 1970s and was formalised by Otto Eckstein and the Council of Economic Advisers staff during the Carter administration. Food and energy prices are dominated by supply shocks: weather events, OPEC decisions, refinery outages, droughts in soy-producing regions, and avian flu in poultry. These shocks reverse. A frost that doubles orange prices in February rarely persists into August. Federal Reserve research documents that food and energy components have monthly standard deviations roughly three to five times higher than the rest of the CPI basket.
Monetary policy works with a lag of 12 to 18 months. Targeting a measure that is dominated by transitory supply shocks would force the Fed to respond to noise. The famous formulation from former Vice Chair Don Kohn was that the central bank should “look through” temporary price shocks while remaining alert to second-round effects on wages and expectations. Core CPI is the operational form of that principle for the headline measure that most households still recognise.
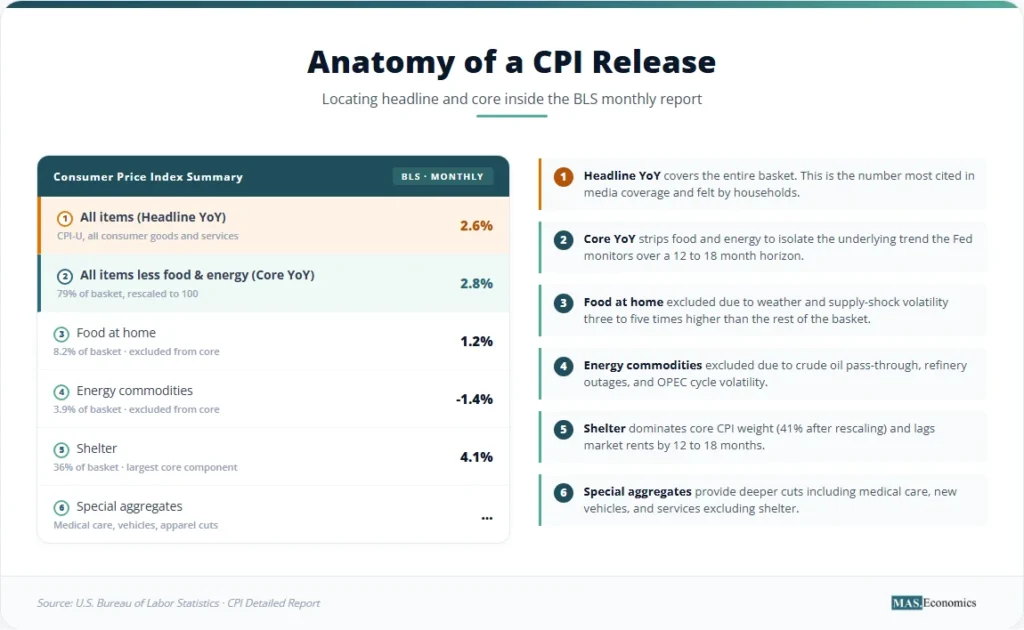
The two measures, side by side. Headline CPI (CPI-U, all items) and Core CPI (CPI-U, all items less food and energy) are published together by the BLS in the same monthly release, usually on the second Wednesday of the month at 8:30 a.m. Eastern. The same basket weights, the same outlets, the same imputation methods. Only the aggregation differs.
Excluding the Volatile
The mechanics of the exclusion are straightforward. The BLS computes CPI-U by weighting roughly 200 item-area cells using Consumer Expenditure Survey weights, updated every two years. To produce the core series, the BLS removes 17 item categories that fall under “food” (food at home plus food away from home) and 6 categories that fall under “energy” (energy commodities including gasoline and fuel oil; energy services including electricity and utility piped gas). The remaining weight is rescaled to 100 percent.
The formal calculation for headline CPI uses a modified Laspeyres formula with base-period quantities:
where \( w_i \) is the basket weight for item \( i \) and \( N \) covers all 200-plus item-area cells. Core CPI applies the same formula over a restricted index set \( S^{\text{core}} \) that excludes food and energy items, with rescaled weights \( \tilde{w}_i = w_i / \sum_{j \in S^{\text{core}}} w_j \):
The exclusion rules have been stable since the BLS began publishing the core series formally in 1978, though the underlying CPI basket weights have been updated through eight major revisions. The table below lists which CPI components stay in the core measure and which drop out, using the 2024 basket weights published in the BLS relative-importance release.
| Component | In Core? | Reason for exclusion or inclusion | Weight in CPI (%) |
|---|---|---|---|
| Shelter (rent and owners’ equivalent rent) | Yes | Persistent, slow-moving prices that anchor underlying trend | 36.1 |
| Food at home | No | Volatile, supply-shock-driven (weather, commodities) | 8.2 |
| Food away from home | No | Excluded with food category despite service character | 5.3 |
| Energy commodities (gasoline, fuel oil) | No | Crude oil pass-through, refinery outages, OPEC cycles | 3.9 |
| Energy services (electricity, piped gas) | No | Natural-gas spot-price volatility, regulatory pass-through | 2.9 |
| Apparel | Yes | Standard core component | 2.5 |
| New and used vehicles | Yes | Standard core component, sensitive to credit conditions | 5.6 |
| Medical care services | Yes | Persistent, contract-driven service prices | 6.5 |
| Transportation services (excluding fuel) | Yes | Service component with administered pricing | 6.0 |
| Recreation and education services | Yes | Core service categories | 11.6 |
| Headline CPI (all items) | 100.0 | Weights sum to 100; core uses 79.0% rescaled to 100 | 100.0 |

|
|||
The 79 percent of the basket that remains in core captures the categories where prices are stickier in the formal sense studied by the Atlanta Fed’s Sticky-Price CPI research: prices that change roughly once every five months or less. Shelter, medical services, education, and most non-fuel transportation services dominate the core basket. The result is a measure that captures the trend that wage growth and inflation expectations actually drive.
What the BLS Does and Does Not Strip Out
Core CPI does not remove every volatile category. Used vehicles, for example, swung from minus 3 percent year-on-year in early 2020 to plus 45 percent by mid-2021 on pandemic supply chain disruption, and remained in core throughout. The exclusion rule is mechanical (food and energy classifications from the BLS hierarchy), not a discretionary screen for volatility. That mechanical character is part of what makes core useful: there is no quarter-by-quarter judgment about which prices to drop. Statistical measures that do screen by volatility, including Sticky-Price CPI and trimmed mean PCE, complement rather than replace the core measure.
When Core Misleads
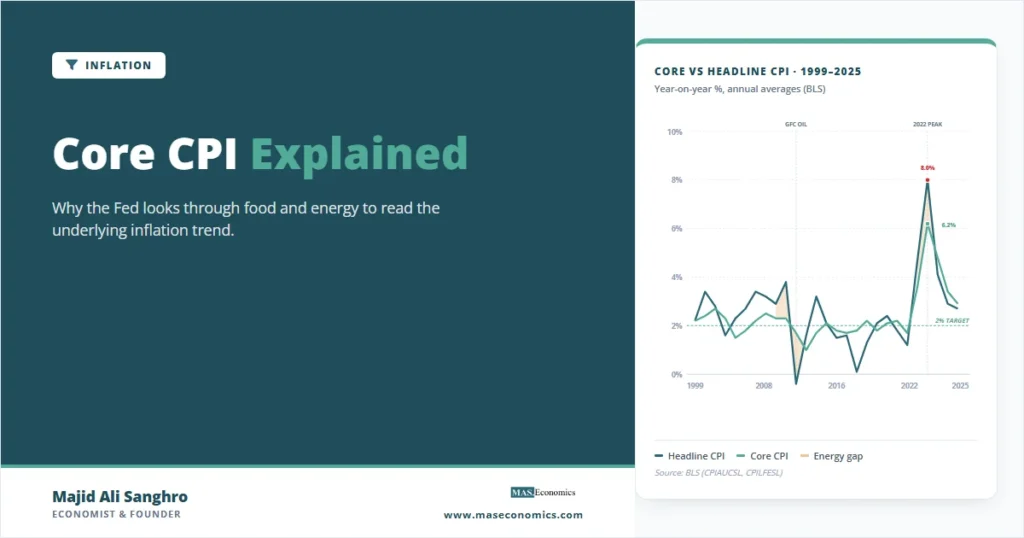
Over the full sample from 1958 to 2024, headline CPI averaged 3.7 percent year-on-year while core CPI averaged 3.8 percent. The two series cross repeatedly, but several episodes show how the gap can mislead in real time. FRED data from the BLS series CPILFESL (core) and CPIAUCSL (headline) document the pattern.
The chart highlights three episodes where the gap mattered most. In 1974, the first OPEC oil embargo pushed headline CPI to 11 percent while core lagged at 8.4 percent. By 1976, the headline rate had fallen to 5.8 percent while core remained at 6.5 percent: the energy spike had passed through into wages, transportation costs, and other downstream prices. The same pattern repeated after 1980. Anyone who declared inflation “beaten” in 1976 by reading the headline drop missed the underlying signal that core was still flashing.
The 2008 episode ran in the opposite direction. Crude oil hit $147 per barrel in July 2008, pushing headline CPI to 5.6 percent in July while core sat at 2.5 percent. By December 2008, headline had collapsed to 0.1 percent on the oil-price reversal, while core barely moved to 1.8 percent. Reading the headline alone would have suggested deflation; reading the core showed that the underlying trend remained near target. The Dallas Fed documents how this distinction shaped the Fed’s response.
The 2021-2024 cycle is the most recent test. Headline CPI peaked at 9.1 percent in June 2022, driven by energy commodities up 60 percent year-on-year following Russia’s invasion of Ukraine. Core CPI peaked four months later at 6.6 percent in September 2022, after the energy shock had passed through into transportation, packaged food, and shelter. The headline measure had already fallen back to 7.1 percent by November 2022; core was still rising. BLS data shows core lagging headline both on the way up and on the way down, exactly the energy pass-through dynamic that the exclusion rule was designed to filter.
Where the Two Diverge: Stylised Patterns
Three regularities emerge from sixty years of joint CPI history. First, in months where headline exceeds core, the gap is almost always driven by energy prices, and the gap typically reverses within 12 to 18 months. Second, when core exceeds headline (as in late 2008, mid-2015, and parts of 2019), an energy-price collapse is usually masked by persistent underlying inflation. Third, the average absolute gap between the two series since 1985 is 0.9 percentage points, but in stress periods (1974, 1980, 2008, 2022) the gap routinely opens to 3 percentage points or more.
What Core Captures That Headline Does Not
The empirical case for core is that it forecasts headline better than headline forecasts itself. James Stock and Mark Watson’s 2007 paper “Why Has US Inflation Become Harder to Forecast?” showed that the core CPI’s one-year-ahead forecast of headline CPI consistently beats a random walk and several model alternatives. The Cleveland Fed’s median CPI research shows similar results: trend-stripping measures dominate headline in horizons relevant to policy.
Core also tracks wage growth more closely than the headline does. Average hourly earnings and the Employment Cost Index correlate roughly 0.65 with core CPI over rolling five-year windows, against 0.45 for headline. The link from wages to underlying inflation runs through services prices and shelter, the categories that dominate core. The link from oil prices to wages is much weaker, which is why inflation expectations measured in surveys tend to respond more to core than to headline at policy-relevant horizons.
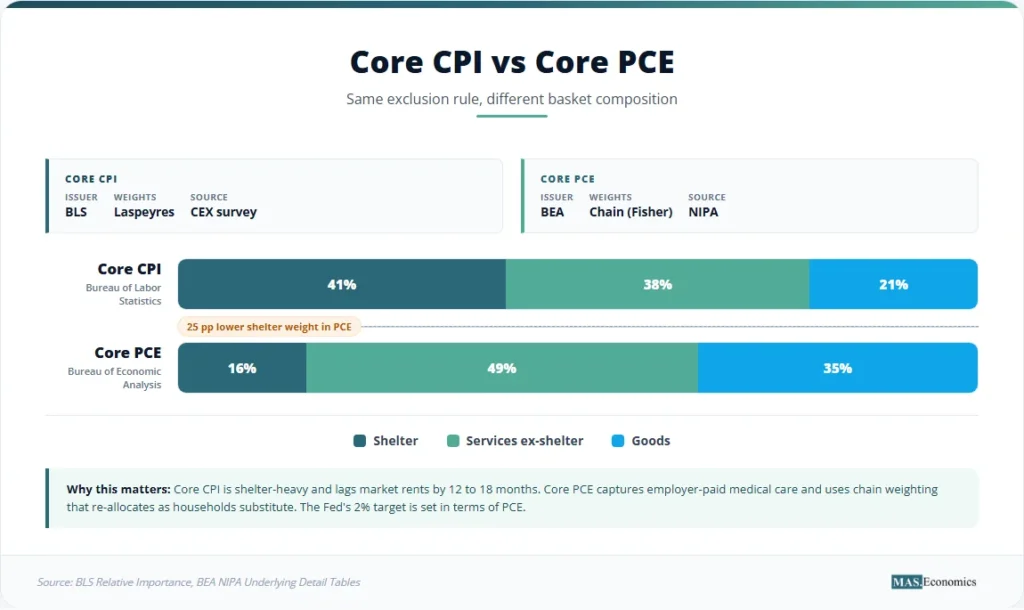
The Fed’s preferred measure is core PCE, not core CPI. The two cores track each other within about 30 basis points on average, but PCE uses chain weighting (Fisher ideal index) rather than Laspeyres, has a smaller shelter weight (about 16 percent versus CPI’s 36 percent), and a different medical-care methodology that includes prices paid by employers and Medicare rather than just out-of-pocket consumer spending. The PCE Index Explained article documents these methodological differences. Both core measures answer the same question with slightly different baskets, and the Fed reports both in every monetary policy statement.
What Core Misses
Core CPI is not a perfect underlying measure. The limitations are well documented in the central bank research literature.
Pass-through is real and asymmetric. Energy and food shocks do enter the core eventually through transportation costs, packaging, restaurant prices, and shelter (heating costs flow into utilities, which are energy services, but cooling costs flow into electricity capacity contracts that feed back into shelter operating costs). The 2022-2023 episode showed that the pass-through can be large and slow. Stripping food and energy assumes the shock is transitory; if the shock persists, the core eventually catches up.
Food at home has structural inflation, not just shocks. Food away from home, which is a service, has roughly the same persistence properties as the core services basket. Excluding it under the food category drops a roughly 5 percent basket weight that arguably belongs in the core. The Cleveland Fed’s median CPI and the Dallas Fed’s trimmed-mean PCE address this by stripping volatile categories item-by-item rather than by category, which keeps food away from home in the underlying measure.
Shelter dominates the index. At 41 percent of core CPI weight (rescaled), shelter movements drive the headline core number. The BLS owners’ equivalent rent methodology lags market rents by 12 to 18 months because of its rolling-survey design. In 2022-2023, core CPI overstated current inflation pressure because shelter was catching up to market rents that had peaked in mid-2022. In 2010-2012, core CPI understated inflation pressure for the same lag reason in reverse.
Used vehicles and other transitory categories stay in core. The pandemic spike in used vehicle prices (up 45 percent year-on-year in mid-2021) added roughly 1.5 percentage points to core CPI at its peak. By the standard of “stable, persistent, monetary-policy-relevant prices,” used vehicles arguably do not belong in the core, yet the mechanical rule keeps them in.
Core gives no signal about household welfare in real time. Households cannot remove food and energy from their grocery and utility bills. For purposes of measuring real wages or the household cost of living, the headline CPI is the right measure. Core’s role is exclusively about policy signal extraction, not welfare measurement.
Core CPI Versus the Modern Underlying Inflation Toolkit
The post-2008 period saw the introduction of several alternative underlying measures designed to address the core’s limitations. The Atlanta Fed Sticky-Price CPI separates the basket by price-change frequency rather than by category, keeping food away from home in the sticky basket and dropping volatile new vehicles. The Cleveland Fed’s median CPI takes the weighted median of monthly category price changes, providing a robust central-tendency estimate. The Dallas Fed’s trimmed mean PCE drops the 24 percent of components with the lowest monthly changes and the 31 percent with the highest, then averages the rest.
None of these alternatives has displaced core CPI in Fed communication or public discussion. The Federal Reserve long-run goals statement sets the 2 percent target in terms of PCE, not CPI, but every monthly FOMC meeting briefing covers core CPI alongside core PCE, median CPI, trimmed mean PCE, and a survey of inflation expectations. The reason for keeping core CPI in the toolkit is that it is the measure most readers, journalists, and market participants encounter first, and it tracks the alternatives closely enough to remain useful.
Cost-push and demand-pull theories map onto the core-versus-headline distinction in a specific way. Demand-pull pressures show up first in the core, because they propagate through wages and service prices. Cost-push shocks, especially supply-driven energy shocks, show up in headline first and only pass through to core if the shock persists or if inflation expectations de-anchor. The 1970s episode involved both oil shocks plus a Fed reaction function that allowed expectations to slip, producing the persistent gap that defined the Great Inflation.
MASEconomics Explains
Three economic concepts behind core CPI
These concepts are explored in depth across our educational articles library.
Explore the MASEconomics BlogConclusion
Core CPI explained is the measure of consumer price inflation that strips food and energy out of the basket to isolate the underlying trend. The BLS publishes it monthly alongside headline CPI; the two share the same Laspeyres methodology and the same item-area cells, differing only in the aggregation set. Core covers roughly 79 percent of the headline basket by weight, with shelter, medical services, and other persistent-price categories dominating.
The Fed looks through food and energy because oil shocks, weather events, and OPEC decisions are dominated by supply factors that reverse within 12 to 18 months, the same horizon over which monetary policy operates. Core CPI forecasts future headline CPI better than headline forecasts itself, correlates with wage growth more tightly than headline, and tracks the persistent prices that inflation expectations actually drive. The 1974, 1980, 2008, and 2022 episodes each show why reading the headline alone produces the wrong policy signal in both directions. Core is not a perfect underlying measure: pass-through is real, shelter lags market rents, and food away from home arguably belongs in core. The Cleveland Fed median CPI, Atlanta Fed Sticky-Price CPI, and Dallas Fed trimmed mean PCE supplement core; none has replaced it.
Frequently Asked Questions
What is the difference between core CPI and headline CPI?
Headline CPI (CPI-U, all items) covers the full consumer basket including food and energy. Core CPI (CPI-U all items less food and energy) excludes the food and energy categories and rescales the remaining 79 percent of the basket to sum to 100. Both are published by the BLS in the same monthly release.
Why does the Fed care more about core CPI than headline CPI?
Food and energy prices are dominated by supply shocks (weather, OPEC, refinery outages) that typically reverse within 12 to 18 months. Monetary policy works with a similar lag, so reacting to transitory shocks would amplify rather than dampen price volatility. Core CPI isolates the underlying trend driven by wages, expectations, and aggregate demand, which is what monetary policy can actually influence.
Is core CPI the same as core PCE?
No. Both strip out food and energy, but they use different baskets, weighting methods, and source data. Core CPI uses the BLS Consumer Expenditure Survey with Laspeyres weighting; core PCE uses BEA National Income and Product Account data with chain-weighted Fisher ideal aggregation. Core PCE has a smaller shelter weight (about 16 percent versus core CPI’s 41 percent) and a broader medical-care definition. The Fed’s 2 percent target is set in terms of PCE, not CPI.
Why is shelter such a large part of core CPI?
Shelter (rent of primary residence plus owners’ equivalent rent) is roughly 36 percent of headline CPI and 41 percent of core CPI after rescaling. The BLS uses owners’ equivalent rent to value the housing services that homeowners consume, which avoids treating houses as investment assets in the index. The rolling-survey methodology means shelter inflation in CPI lags market rents by 12 to 18 months.
When does core CPI give a misleading signal?
Core misleads when an energy or food shock persists long enough to pass through into transportation, packaging, restaurant prices, and shelter. The 1973-1978 oil-shock period is the textbook case: core lagged headline on the way up, then stayed elevated after headline had fallen. Core also misleads during episodes when categories that remain in core become temporarily volatile, as used vehicles did in 2021-2022.
Thanks for reading! If you found this helpful, share it with friends and spread the knowledge. Happy learning with MASEconomics