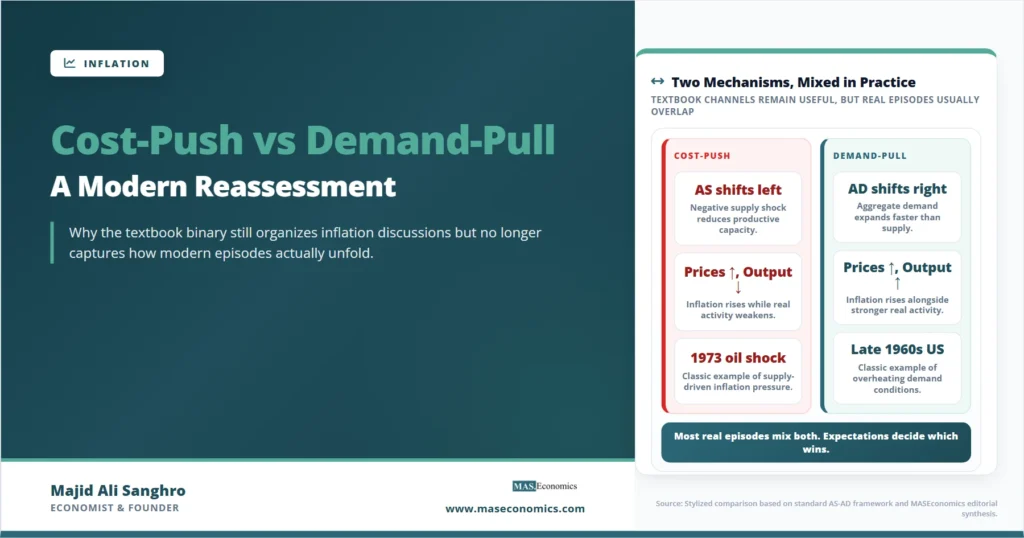
When inflation rose sharply in 2021 and 2022, economists and journalists immediately debated whether the surge was demand-pull inflation, driven by an overheated economy, or cost-push inflation, driven by supply disruptions and energy prices. The answer mattered for policy. Demand-pull pointed to interest rate hikes. Cost-push pointed to patience while supply normalized. As the data came in over 2022 and 2023, the binary did not fit the episode well. The cost-push vs demand-pull framework, born in mid-twentieth-century textbook economics, remains useful for organizing causes of inflation, but the modern empirical record forces a more layered reading. Most real inflation episodes mix both forces; the boundary between them is blurred by expectations and pass-through, and the policy implications depend less on which label fits than on how the underlying shocks behave.
Cost-Push vs Demand-Pull Origins
The cost-push vs demand-pull framework comes out of post-war Keynesian and Phillips Curve economics. Its appeal was diagnostic. If inflation were demand-pull, the aggregate demand curve would have shifted outward against a stable aggregate supply curve. Output rose, unemployment fell, and prices rose together. Policy could cool inflation by reducing demand through fiscal restraint or higher interest rates, and the cost would be a return to slack in the labor market.
If inflation were cost-push, the aggregate supply curve would have shifted inward, raising input costs (energy, wages, imported materials) regardless of where demand stood. Output fell, unemployment rose, and prices rose together. Stagflation was the textbook signature. Demand-management tools could still bring inflation down, but only by accepting a deeper recession than would be needed to address pure demand-pull. The supply shock had already done some of the damage.
The 1970s oil crisis and the associated stagflation made cost-push the dominant explanation in policy circles for nearly a decade. The Volcker disinflation of the early 1980s, achieved by aggressively compressing demand, shifted the consensus back toward a hybrid view: even supply-driven inflation responded to demand restraint, because once inflation expectations rose, the source of the original shock mattered less than the propagation mechanism. The flat Phillips Curve of the 1990s and 2000s seemed to vindicate that hybrid view: inflation stayed low through small shocks of both types, because the monetary regime made expectations the dominant force.
Empirical Signatures of Demand-Pull and Cost-Push
The basic mechanics differ. Demand-pull inflation arises when nominal spending exceeds the economy’s capacity to produce at current prices. The classic conditions include fiscal expansion in a near-full-employment economy, a credit boom, a sustained drop in the household saving rate, or a positive net exports shock. In all of these, the impulse comes from the buying side. Firms respond first by drawing down inventories, then by raising prices, then by hiring more labor and capital. The wage adjustment tends to follow the price adjustment with a lag.
Cost-push inflation arises when production costs rise faster than productivity. The triggers include energy and commodity shocks, exchange-rate depreciation that raises import costs, broad-based wage settlements above productivity growth, regulatory cost increases, or supply-chain disruptions. The impulse comes from the supply side. Firms first absorb costs through reduced margins, then pass them through to prices, then either contract output or pass higher prices upstream into intermediate goods. The wage response can either come first (a wage-led cost push, more common in indexed economies) or later (as workers seek to recover lost purchasing power).
Definition. Demand-pull inflation: prices rise because aggregate demand exceeds productive capacity. Cost-push inflation: prices rise because input costs rise faster than productivity. The two often appear simultaneously, which is why the simple binary often fails to describe modern inflation episodes.
The two also show up differently in the data. A demand-pull episode is usually associated with rising employment, falling unemployment, and capacity utilization above its long-run average. A cost-push episode is usually associated with falling real wages, terms-of-trade losses, and sectoral price pressure that begins in the cost-shocked input rather than spreading uniformly across the basket.
| Indicator | Demand-pull | Cost-push |
|---|---|---|
| Direction of impulse | Buyer side: spending outpaces capacity | Supplier side: input costs rise faster than productivity |
| Employment effect | Rising employment, falling unemployment | Falling output, rising unemployment |
| Real wages | Often rising during the boom | Usually falling during the shock |
| Capacity utilization | Above long-run average | Below or at long-run average |
| Price spread | Broad-based across categories | Concentrated in cost-shocked inputs first |
| Typical episode | Late 1960s US (Vietnam War + Great Society) | 1973–74 and 1979–80 oil crises |
| Policy response | Reduce demand: higher rates, fiscal restraint | Look through if transitory; tighten if expectations move |
|
Source: Standard macroeconomic framework synthesis; episode dating from NBER Business Cycle Dating Committee and Federal Reserve historical inflation analyses.

|
||
AS-AD Geometry of Inflation Shocks
The cleanest way to see the two cases is through the aggregate supply and aggregate demand framework. Both raise prices, but they shift output in opposite directions, which makes the diagnosis informative when the data are clean.
The diagrams are clean. The real-world data rarely are. Most episodes show both curves moving at once, often in offsetting directions, which makes the diagnosis a matter of decomposing the inflation series into shock contributions rather than picking a single label.
Modern Reassessment of the Binary
The traditional framework rests on three assumptions that empirical work has chipped away at over the past three decades. The first is that the source of the shock determines the policy response. The second is that supply and demand shocks can be cleanly separated. The third is that inflation expectations are stable. None of these holds well in modern data.
On the policy side, central banks since the 1990s have converged on responding to inflation deviations from target rather than to inflation sources. Under inflation targeting, a credible commitment to a numerical target means the policy response is largely independent of whether the underlying shock is supply or demand driven. The standard prescription is to look through transitory supply shocks (because their direct effect fades on its own) but to tighten when those shocks threaten to unanchor expectations. The diagnostic question shifts from “is this cost-push or demand-pull?” to “is this transitory or persistent?”
On the decomposition side, the supply-vs-demand boundary blurs once you account for endogenous responses. A supply shock that raises energy prices reduces real disposable income, which lowers demand for other goods. A demand boom that raises commodity prices through global trade then feeds back into cost pressure in commodity-importing economies. Modern decomposition methods, including the Bernanke-Blanchard (2023) framework applied to the 2022 inflation episode, attempt to estimate the contribution of distinct shocks rather than classify episodes into a binary.
On expectations, the modern view treats inflation expectations as the dominant variable for inflation persistence. As inflation expectations research has shown, when long-run expectations stay anchored at the central bank’s target, both supply-driven and demand-driven shocks fade more quickly. When expectations move, both types of inflation become more persistent. The same shock can produce a transient blip or a sustained inflation regime depending on what expectations do.
2021–2024 Inflation: Testing the Binary
The pandemic-era inflation surge offered the cleanest natural experiment in 50 years for the cost-push vs demand-pull framework. The initial signal was mixed. Supply chains were disrupted, energy and food prices rose sharply (especially after the Russian invasion of Ukraine in early 2022), and shipping rates spiked. These were unambiguous cost-push signals. At the same time, US fiscal stimulus between 2020 and 2021 totaled roughly six trillion dollars, household savings spiked, employment recovered rapidly, and demand for durable goods reached levels far above trend. These were unambiguous demand-pull signals.
The interpretive divide that emerged among economists tracked the cost-push vs demand-pull divide closely. One camp, including Larry Summers and Olivier Blanchard, argued the fiscal expansion had pushed aggregate demand well past the economy’s capacity, producing the standard textbook demand-pull pattern. The other camp, more visible at the IMF and the Federal Reserve research staff, argued that supply factors dominated and the inflation would fade as supply chains normalized.
Empirical decompositions published from 2023 onward, including Bernanke and Blanchard (2023), found that the initial inflation rise was overwhelmingly driven by product-market shocks, particularly energy, food, and durable goods supply constraints. As the 2022 energy crisis showed, the supply-side contribution was large enough that it would have produced significant inflation even without fiscal support. But the demand contribution mattered for the subsequent path. The tightness of the US labor market, with unemployment falling below 4 percent through 2022, allowed firms to pass through cost increases more aggressively than in a slack economy. Demand and supply were not separate stories. Demand conditioned the size of the cost pass-through.
The 2023–2024 disinflation made the same point in reverse. Headline inflation fell sharply as supply chains normalized and energy prices retreated, which was a cost-push channel working in reverse. Service inflation, which tracks sticky services dynamics and depends more on the labor market than on commodity prices, fell more slowly. The decomposition of the disinflation matched the decomposition of the original surge. Both forces had been active throughout.
Caveat. Decomposing inflation into supply and demand contributions depends on identification assumptions in structural VAR or DSGE models. Different identification strategies can attribute the same inflation rise to different combinations of shocks. The qualitative message (most episodes are mixed) is robust; the precise quantitative split is not.
Markup Channel and the Greedflation Debate
One development in the modern reassessment deserves a separate note: the role of corporate markups. The traditional cost-push story assumes firms pass cost increases through to prices roughly one-for-one, with markups held constant. Several papers published since 2022 documented that aggregate markups rose in 2021–2022 alongside the inflation surge, particularly in concentrated sectors. The interpretation became politically charged. Some economists treated rising markups as a third channel beyond cost-push and demand-pull, often labeled “sellers’ inflation” or “greedflation.” Others argued that markups rose because demand conditions allowed it, not because firms suddenly became greedier.
The empirical record, including work by Isabella Weber and Evan Wasner and a counter-literature from the Federal Reserve and the IMF, suggests something more nuanced. Markups did rise temporarily during the period of supply disruption, particularly in goods sectors where firms faced both higher input costs and unusually strong demand. But the markup expansion was mostly reversed by 2023 and 2024 as supply normalized and competitive pressure resumed. As the greedflation debate shows, the cleaner reading is that markups acted as an amplifier of the initial cost-push shock under tight-demand conditions, rather than as an independent inflation source.
This points to a more general principle. The cost-push vs demand-pull framework treats each force as exogenous and separate. In modern economies, the pass-through coefficient itself, how much of a cost shock becomes a price increase, depends on demand conditions and on the state of competition. The binary becomes an interaction.
Enduring Value of the Framework
Despite the modern critique, cost-push vs demand-pull remains useful for three reasons. It correctly identifies that not all inflation has the same policy implications. A purely transitory cost shock that does not move expectations should be looked through. A demand-driven inflation that reflects sustained excess spending requires action. The framework forces this distinction even if the labels are imperfect.
It correctly identifies the direction of the output response. Demand-pull inflation comes with stronger output and lower unemployment; cost-push inflation comes with weaker output and higher unemployment. As stagflation data shows, this signature is real even when the labels blur in the middle. Policymakers reading the data want to know whether they are looking at an overheating economy or a supply shock, and the framework gives them a vocabulary for that question.
And it correctly identifies that even the most credible monetary regime cannot make a real supply shock costless. When energy prices rise, real incomes fall, and that real cost has to be absorbed somewhere. The central bank can prevent the shock from becoming a sustained inflation by holding expectations down, but it cannot reverse the underlying loss. The cost-push framework names the constraint even when it cannot guide the response.
Explains
Three concepts that frame the cost-push vs demand-pull debate.
Continue with related inflation theory and decomposition tools.
Explore the MASEconomics BlogConclusion
The cost-push vs demand-pull framework remains a useful starting point for thinking about inflation, but the modern empirical record requires a layered application. Most real inflation episodes mix both forces. The pass-through of a cost shock to consumer prices depends on the state of demand. Inflation expectations sit above both channels and determine how persistent the response will be. Policy responds to the trajectory of inflation and expectations rather than to a clean source diagnosis. And the modern markup channel adds a third dimension that the binary does not capture cleanly.
What the framework still does well is force a basic question that should anchor every inflation discussion: where is the impulse coming from, and where is it going? The 2021 to 2024 episode showed both that the binary is too narrow to describe modern inflation episodes and that the underlying questions it organizes are still the right questions to ask. A central bank that cannot tell whether it is looking at supply-driven or demand-driven inflation will misjudge how long the inflation will persist and how aggressive its response needs to be. The labels are old. The diagnostic discipline behind them is not.
Frequently Asked Questions
What is the difference between cost-push and demand-pull inflation?
Demand-pull inflation happens when total spending exceeds the economy’s capacity to produce at current prices, so firms raise prices to ration the excess demand. Cost-push inflation happens when input costs (energy, wages, imported materials) rise faster than productivity, so firms raise prices to maintain margins. Demand-pull usually comes with strong output and falling unemployment; cost-push usually comes with weaker output and rising unemployment.
Was the 2022 US inflation cost-push or demand-pull?
It was both. The initial surge was driven mainly by supply-side shocks: pandemic disruptions, energy and food prices, and shipping costs. But strong demand, supported by fiscal stimulus and a tight labor market, allowed firms to pass cost increases through to prices more aggressively than they could have in a slack economy. Most rigorous decompositions, including Bernanke and Blanchard’s 2023 paper, find supply factors dominated the initial rise but demand conditioned the pass-through.
How does cost-push inflation differ from stagflation?
Stagflation is the joint occurrence of high inflation and high unemployment. Cost-push inflation is one common cause of stagflation, because supply shocks raise prices and reduce output at the same time. But not every cost-push episode becomes stagflation; a small or transitory supply shock can raise prices briefly without producing a meaningful recession.
Should central banks respond differently to cost-push vs demand-pull inflation?
In principle yes. Demand-pull inflation should be met with tighter policy because it reflects excess spending that demand restraint can cool. Cost-push inflation from transitory supply shocks can often be looked through if expectations stay anchored. In practice, modern central banks respond more to the trajectory of inflation and the behavior of expectations than to a binary diagnosis of the shock source.
Are corporate profits a third source of inflation?
The evidence suggests rising markups acted as an amplifier of the 2021–2022 cost-push shock rather than as an independent inflation source. Firms raised markups partly because supply disruptions reduced competitive pressure and partly because strong demand allowed it. As supply normalized and competition resumed in 2023–2024, most of the markup expansion reversed. The greedflation framing captures a real channel but tends to overstate its independence from underlying supply and demand conditions.
Thanks for reading! If you found this helpful, share it with friends and spread the knowledge. Happy learning with MASEconomics