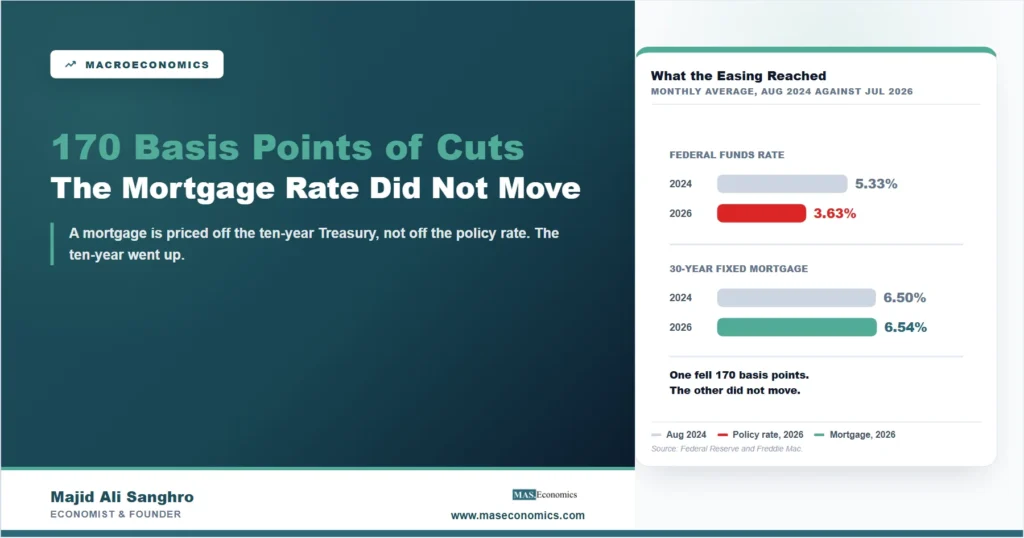
In September 2024 the Federal Reserve began lowering its policy rate after holding it at 5.33 percent for thirteen months. Anyone who had postponed buying a house, refinancing a loan or borrowing for a business had been told, in effect, to wait for this. The waiting has now lasted almost two years. The effective federal funds rate has fallen 170 basis points, to 3.63 percent in July 2026. Over the same period the thirty-year fixed mortgage rate has not fallen at all. It averaged 6.50 percent in the month before the first cut and 6.54 percent in July 2026, and the most recent weekly reading, on 6 August 2026, is 6.69 percent. Fed rate cuts that were supposed to make borrowing cheaper have left the cost of the largest loan most households ever take almost exactly where it was.
This is not a complaint about banks, and it is not a sign that something has broken. It is a fairly precise statement about which interest rate the Federal Reserve controls and which one a mortgage is priced from, and the two are not the same rate. What follows is an attempt to show, with the series themselves, where the easing went and why it stopped short.
The Policy Rate Fell 170 Basis Points and the Ten-Year Went the Other Way
Start with the three numbers side by side, because the picture is unusual enough that it is worth seeing before it is explained.

The ten-year Treasury yield averaged 3.87 percent in August 2024, the month before the first cut. In July 2026 it averaged 4.60 percent, and it closed at 4.69 percent on 6 August 2026. So the policy rate fell 170 basis points while the benchmark long rate rose by roughly 70 to 95 basis points depending on which endpoints are used. The gap between the two moved by well over two percentage points, in the direction opposite to the one the textbook account expects.
It is worth establishing how unusual that is rather than asserting it. Taking every month since 1991 and comparing the change in the federal funds rate over the preceding twelve months with the change in the average ten-year yield over the same twelve months, there are 25 months out of 427 in which the funds rate fell by at least half a point while the ten-year rose. Twelve of those 25 months belong to the current episode. Nearly half of all the occasions in thirty-six years on which easing coincided with a rising long rate have happened since December 2024.
The curve itself tells the same story from a different angle. The spread between the ten-year and the two-year is positive 0.46 percentage points and has been widening. Between April 2022 and September 2024 that spread was negative on 541 trading days, the longest such stretch in the series, and the last inverted day was 5 September 2024, two weeks before the first cut. Since 1990 the curve has been inverted on 1,052 of 9,156 trading days, about 11.5 percent of the time. The steepening since then has not come from long rates falling more slowly than short rates. It has come from short rates falling while long rates rose.
The Federal Reserve Sets One Rate, and It Is Not the One on the Loan
The phrase “the Fed sets interest rates” is a convenient shorthand that becomes misleading in exactly this situation. What the Federal Open Market Committee sets is a target range for the federal funds rate, the rate at which banks lend reserves to each other overnight. Everything else is a price, determined by what buyers will pay and sellers will accept, and the influence of the policy rate on those prices runs through expectations rather than through control.
A ten-year Treasury yield can be thought of as two components added together. The first is the average short-term interest rate that investors expect to prevail over the next ten years. The second is the term premium, which is the extra compensation investors require for locking money up for a decade instead of rolling overnight loans. A cut today moves the first component only to the extent that it changes what people expect for the rest of the decade. It does nothing directly to the second.
That distinction is usually academic, because the two components normally move together. It is not academic now. The table below sets out what the easing cycle reached and what it did not.
| Rate | 5 September 2024, the eve of the first cut | 6 August 2026 | Change |
|---|---|---|---|
| Effective federal funds rate (monthly series) | 5.33% (Aug 2024) | 3.63% (Jul 2026) | down 170 bp |
| 2-year Treasury | 3.75% | 4.25% | up 50 bp |
| 10-year Treasury | 3.73% | 4.69% | up 96 bp |
| 30-year Treasury | 4.02% | 5.22% | up 120 bp |
| 10-year term premium (ACM estimate) | 0.07% | 0.87% (31 Jul 2026) | up 79 bp |
| 30-year fixed mortgage | 6.35% | 6.69% | up 34 bp |
| Baa corporate spread over 10-year | 1.73% | 1.61% | down 12 bp |
|
|
|||
Read down the maturity ladder and a pattern appears that is more informative than any single row. The two-year rose 50 basis points, the ten-year 96, the thirty-year 120. The longer the maturity, the larger the increase. An easing cycle that was being priced into expectations would do the reverse, pulling the near end down hardest and leaving the far end alone. What actually happened is the signature of something being added at the long end, and it grows with the length of the commitment.
The last row rules out the most common alternative explanation. If investors had become worried about credit risk, corporate borrowing costs would have risen relative to government ones. Instead the spread of Baa-rated corporate bonds over the ten-year Treasury fell from 1.73 to 1.61 percentage points, and it sits well below its 1990 to 2026 average of 2.28. This is not a flight to safety or a credit event. The increase is in the government curve itself, which is the benchmark everything else is priced from.
The Mortgage Rate Tracks the Ten-Year, Not the Federal Funds Rate
The claim that a mortgage is priced off the long end rather than the policy rate can be tested directly, and the test is simple enough to reproduce. Take the monthly change in the thirty-year fixed mortgage rate, the monthly change in the ten-year Treasury yield and the monthly change in the effective federal funds rate, over 438 months from February 1990 to July 2026.
The correlation between monthly changes in the mortgage rate and monthly changes in the ten-year is 0.86. The correlation between monthly changes in the mortgage rate and monthly changes in the federal funds rate is 0.17. Run both against the mortgage rate at once and the ten-year carries a coefficient of 0.78, while the federal funds rate carries 0.02. A one point move in the ten-year yield is associated with a 0.78 point move in the mortgage rate. A one point move in the policy rate, holding the ten-year fixed, is associated with almost nothing.
Splitting the sample does not change the conclusion. The ten-year coefficient is 0.79 over 1990 to 2007, 0.66 over 2008 to 2015, 0.91 over 2016 to 2026 and 1.08 over 2021 to 2026. The federal funds coefficient ranges from −0.08 to 0.13 and is small in every period. These are descriptive relationships between contemporaneous changes rather than a causal estimate, and they should be read that way, but the pattern is stable across four decades, three recessions and two very different monetary regimes.
That is why the current episode produces the result it does. Between August and October 2025 the ten-year fell from 4.39 to 4.06 percent and the mortgage rate fell from 6.72 to 6.25. Between April and July 2026 the ten-year rose from 4.32 to 4.60 and the mortgage rate rose from 6.33 to 6.54. Through both moves the federal funds rate only ever went down. The mortgage market has been responding faithfully to a signal, and the signal is not the one that gets announced at a press conference. The mechanics of how those loans are funded and priced are set out in the article on how the world’s biggest loan market works.
Lenders are not absorbing the difference either. The spread of the mortgage rate over the ten-year Treasury was 2.62 percentage points on the eve of the first cut and is 2.00 now, against 2.08 in August 2019 and 1.58 in August 2021. That spread has narrowed by more than half a point, which means mortgage pricing has become more favourable relative to the benchmark, not less. Everything that could be passed on has been. The benchmark underneath it simply did not fall.
Four Fifths of the Increase Is Term Premium
If the rise in long rates is not credit risk and not lender margins, the remaining candidates are expectations and the term premium. These can be separated, because the Federal Reserve Bank of New York publishes an estimate of the ten-year term premium from the model of Adrian, Crump and Moench, available as FRED series THREEFYTP10.
On 5 September 2024 the estimated ten-year term premium was 0.07 percentage points. On 31 July 2026 it was 0.87. The ten-year yield itself rose 96 basis points over that period, and 79 of those basis points are term premium. The component that reflects expected future short rates accounts for about 17 basis points of the move.
This is the finding that reframes the whole episode. The bond market has not decided that the Federal Reserve will reverse course, and it has not stopped believing the cuts will continue. Expectations of future policy have barely moved. What has changed is the price of duration itself. Investors now demand nearly a full percentage point of extra compensation to hold a ten-year note rather than roll short-term paper, and that demand has nothing to do with the next few FOMC meetings.
The historical context makes the scale of the shift clearer. The term premium was negative for 34 consecutive months between March 2019 and December 2021, and it was last negative in May 2023. A negative term premium means investors were accepting less than the expected path of short rates in order to hold a long bond, which is what happens when a large, price-insensitive buyer is absorbing the supply and when long bonds are valued as insurance against recession. Both conditions have gone. The unwinding of the central bank’s balance sheet removed the buyer, and the earlier piece on where the federal interest bill goes documents what replaced it: holdings of advanced economy government debt shifted from central banks, whose share fell from 27 to 17 percent, to non-bank financial institutions, whose share rose from 44 to 53 percent. Pension funds, insurers and leveraged funds are price-sensitive in a way a central bank conducting policy is not. They have to be paid to take duration, and the payment is the term premium.
Supply is the other half of it. A government running a deficit near 5.8 percent of GDP with debt above 122 percent of GDP has to sell a great deal of paper into that market every month, and the buyers now setting the price are the ones who ask what they are being paid for the risk. The relationship between the size of the debt and the room a central bank has to work in is the subject of the article on how government debt constrains monetary policy.
Greenspan Had the Same Problem, in Reverse
This is not the first time the long end has ignored the Federal Reserve, and the previous occasion is instructive because it ran in the opposite direction.
Between June 2004 and June 2006 the effective federal funds rate rose from 1.03 percent to 4.99 percent, an increase of almost four percentage points. Over the same two years the ten-year Treasury yield went from 4.62 percent to 5.15 percent, a rise of 53 basis points. Halfway through, at the end of June 2005, after the Federal Reserve had already tightened by two full points, the ten-year was 3.94 percent, lower than when the tightening began.
Alan Greenspan raised this in his Monetary Policy Report testimony of 16 February 2005, where he said the behaviour of world bond markets “remains a conundrum.” The explanations offered afterwards centred on the demand side: heavy purchases of Treasury securities by foreign official institutions accumulating reserves, a global excess of desired saving over desired investment, and pension funds obliged to hold long-dated assets. All of them compressed the term premium and held long yields down while the Federal Reserve pushed short yields up.
Twenty years later the same disconnect is running the other way, and the explanation has inverted along with it. In 2005 a wall of price-insensitive demand held long rates down against a tightening central bank. In 2026 the withdrawal of price-insensitive demand is holding long rates up against an easing one. In both cases the policy rate did what it was told and the term premium did something else, which is a reminder that the long end has always been a market price with its own supply and demand rather than an extension of the policy decision. The shape of the yield curve is read as a forecast so routinely that it is easy to forget it is also a record of who is buying.
The practical difference between the two episodes matters. Greenspan’s conundrum made monetary policy weaker than intended in a period when the concern was an overheating housing market. The current version makes it weaker than intended in a period when households are waiting for relief. In 2005 the missing transmission inflated an asset price. In 2026 it withholds a reduction in a payment. The general lesson about how monetary policy actually travels through an economy is that the number announced is only the first step of the journey.
The Long End Rose Almost Everywhere, Which Is Why This Is Not Only an American Story
A reader outside the United States might treat this as a domestic curiosity. It is not, for two reasons, and the second is the more important one.
The first is the familiar benchmark channel. The ten-year Treasury yield is the reference price for long-term borrowing in most of the world. Corporate bonds are priced against it, sovereign spreads are quoted over it, and a rise in the American term premium raises the cost of long-dated money in places that took no monetary policy decision at all. A term premium is not a national quantity. It is the price of holding duration, and duration is priced globally.
The second is that the same repricing is visible in other government bond markets, and the dispersion is now very wide.
| Economy | Long-term government bond yield, June 2026 |
|---|---|
| Australia | 4.83% |
| United Kingdom | 4.80% |
| United States | 4.47% |
| France | 3.68% |
| Canada | 3.42% |
| Germany | 2.97% |
| Japan | 2.67% |
|
|
|
Two points in that table deserve attention. The United States is no longer the cheapest long-term borrower among large advanced economies, which was taken for granted for most of the post-war period. Australia and the United Kingdom now pay more, and France pays 71 basis points more than Germany inside a single currency, which is a statement about credit rather than about monetary policy.
Japan is the largest change of all. A ten-year yield of 2.67 percent is unremarkable in any other country and is a regime shift in a market that spent a decade under explicit yield curve control, the policy described in the article on the Bank of Japan’s long experiment and its exit. Japanese institutions were among the largest foreign buyers of long-dated foreign bonds precisely because domestic yields offered nothing. When they can earn 2.67 percent at home, some of that money stays home, and the demand that used to compress term premiums in other markets does not arrive. The withdrawal of price-insensitive demand is not only an American phenomenon, and Japan is the clearest single case of it.
What Would Actually Bring Long Rates Down
The uncomfortable implication of the decomposition is that further cuts, on their own, are unlikely to fix this. If four fifths of the increase is term premium and the expectations component is already priced, then lowering the policy rate again mainly moves the part of the curve that has already moved.
Three things would lower the long end, and they are worth naming honestly because two of them are not attractive.
The first is less issuance, or a credible commitment to less issuance in future. Term premium responds to the quantity of duration the market is asked to absorb. This is a fiscal decision rather than a monetary one, and it belongs to Congress rather than to the Federal Open Market Committee. The relationship between the two arms of policy is set out in the piece on the two tools and their different trade-offs.
The second is a return of price-insensitive demand, which in practice means either a central bank buying again or a fall in yields abroad that pushes foreign money back into Treasuries. A central bank restarting purchases outside a crisis would be a significant change of policy, and yields abroad falling would require the Japanese and European normalisation of the last two years to reverse.
The third is a recession. Long rates fall reliably when growth expectations collapse, and that is the mechanism nobody is advocating. It is worth stating plainly because a good deal of commentary treats lower long rates as an unambiguous good without naming the most common historical route to them.
Meanwhile the arithmetic for a household is straightforward. On a $400,000 thirty-year mortgage, the difference between the current rate of 6.54 percent and the 4.80 percent that would apply if the full 170 basis points of easing had passed through is about $440 a month, or roughly $5,282 a year in principal and interest. That is the size of the transmission failure expressed in the only unit that matters to the person paying it. It is also why explanations of housing costs that stop at the policy rate miss most of the story, a point developed in the article on why homes keep getting more expensive.
MASEconomics Explains
3 economic concepts behind the missing pass-through
These concepts are explored in depth across our educational articles library.
Conclusion
Fed rate cuts totalling 170 basis points since September 2024 have lowered the overnight rate at which banks lend to each other and have left the thirty-year mortgage rate almost exactly where it started. The ten-year Treasury yield, which is what mortgages are actually priced from, rose over the same period. That is not a failure of the banking system, and the evidence rules out the usual alternative explanations: credit spreads narrowed rather than widened, and the mortgage rate’s own margin over the ten-year fell by more than half a percentage point.
The mechanism is the term premium. Of the 96 basis point rise in the ten-year yield since the eve of the first cut, 79 basis points are term premium and roughly 17 are changed expectations about future policy. Investors have not stopped believing in the easing cycle. They have started charging considerably more to hold duration, at a time when the government is issuing a great deal of it and the buyer that used to absorb it without asking the price has been shrinking its balance sheet rather than expanding it.
The lesson generalises beyond this cycle and beyond the United States. A central bank controls one overnight rate, and the rates that decide whether a house is affordable or a factory gets built sit ten and thirty years further out on a curve that is a market price. Greenspan met the same wall in 2005 with the sign reversed. The useful habit, for anyone trying to read what a rate decision will mean, is to watch the long end rather than the announcement, because the long end is where the answer is actually determined.
Frequently Asked Questions
Why did mortgage rates not fall when the Federal Reserve cut rates?
Because mortgages are priced off long-term Treasury yields, not off the overnight policy rate. Since 1990 the correlation between monthly changes in the thirty-year mortgage rate and monthly changes in the ten-year Treasury yield is 0.86, against 0.17 for the federal funds rate. The federal funds rate fell 170 basis points after September 2024 while the ten-year rose, so the rate that matters for a mortgage went up.
What is the term premium and why does it matter here?
The term premium is the extra yield investors demand for holding a long bond rather than rolling short-term ones. The New York Fed’s estimate for the ten-year rose from 0.07 percent in September 2024 to 0.87 percent in July 2026. That accounts for 79 of the 96 basis point rise in the ten-year yield, which means the increase reflects the price of duration rather than a change in what investors expect the Federal Reserve to do.
Does this mean the market expects the Federal Reserve to raise rates again?
No. The component of the ten-year yield that reflects expected future short rates moved by roughly 17 basis points over the period, which is small. Expectations about policy are close to where they were. What changed is the compensation required to bear duration risk.
Has this happened before?
Yes, in reverse. Between June 2004 and June 2006 the federal funds rate rose from 1.03 to 4.99 percent while the ten-year Treasury yield rose only 53 basis points, and it was lower after two years of tightening at one point in mid-2005. Alan Greenspan called the behaviour of world bond markets a conundrum in his February 2005 testimony. The explanation then was heavy price-insensitive buying of Treasuries, which compressed the term premium.
Would more rate cuts bring mortgage rates down?
Not necessarily, and not directly. Further cuts move the short end of the curve and the expectations component of long yields, which is the part that has already moved. Long rates depend more on the supply of government debt being issued and on the presence of buyers willing to absorb it. Those are fiscal and portfolio questions rather than monetary policy decisions.
Is this an American problem only?
No. The ten-year Treasury yield is the benchmark for long-term borrowing worldwide, so a higher American term premium raises long-dated borrowing costs elsewhere. Long yields have also risen across other advanced economies, with June 2026 readings of 4.83 percent in Australia, 4.80 in the United Kingdom, 3.42 in Canada, 2.97 in Germany and 2.67 in Japan, the last of which is a substantial change for a market that spent years under yield curve control.
Thanks for reading! The next time a rate decision is announced, the more useful number is the one the bond market sets an hour later. Happy learning with MASEconomics