Several times a decade, a country’s inflation rate falls sharply while nothing in its shops gets cheaper, and politicians claim credit for arithmetic. The phenomenon is called base effects inflation analysis, and the mechanism fits in a sentence: an annual inflation rate compares today’s prices with those of twelve months ago, so the rate moves whenever either end of the comparison changes. When an old price shock reaches its first birthday, it drops out of the base, and the annual rate falls mechanically, no policy triumph, no relief at the checkout, just a calendar doing its work. The same trick runs in reverse: an unusually cheap month a year ago inflates today’s measured rate even if prices have barely moved since spring.
Base effects are the most predictable events in economic statistics, visible a full year in advance to anyone holding a calendar of last year’s shocks, and they still generate confused headlines every cycle. Learning to separate them from genuine changes in price pressure is one of the highest-return skills in reading inflation data, and it requires nothing more than remembering what happened twelve months ago.
One Shock, Thirteen Months of Headlines
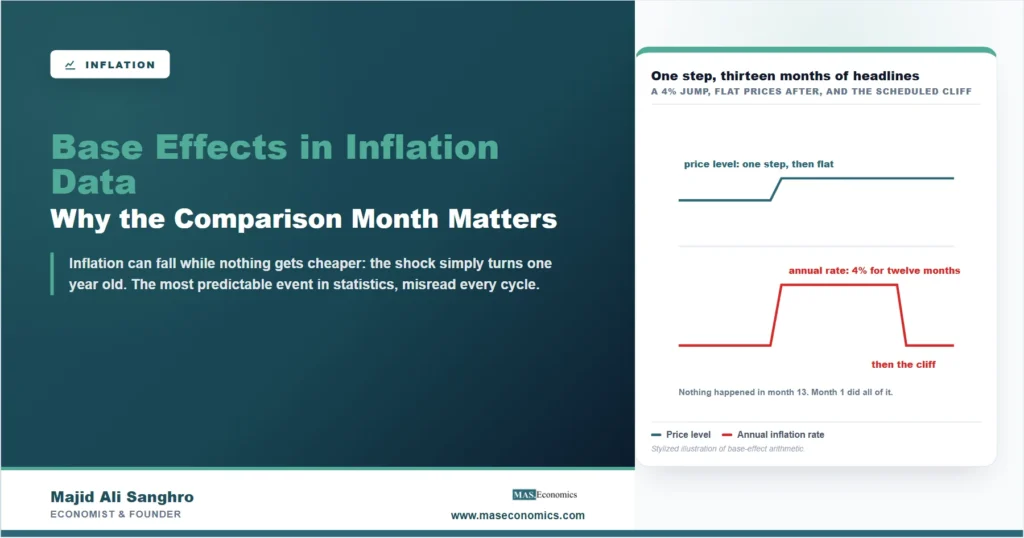
Follow a stylized economy through a single event. Prices are flat; annual inflation reads zero. In one month, an energy shock lifts the entire price level by 4 percent, and prices then stay exactly flat at the new, higher plateau. What do the headlines report? For the shock month and the eleven that follow, the annual comparison spans the jump: every reading says 4 percent inflation, month after month, even though prices stopped rising almost a year ago. Then, in month thirteen, the jump enters the base, the comparison runs from plateau to plateau, and inflation collapses to zero in a single release. Nothing happened in month thirteen. Everything reported in month thirteen was caused by month one.
The cliff in that chart is pure base effect, and real economies produce softer versions of it constantly. Energy shocks are the classic generators, which is why the reversal of oil-driven inflations always includes a scripted-in-advance phase where annual rates fall fast on anniversary dates. Administered prices generate the sharpest cases: a regulated energy tariff reset once or twice a year creates cliffs on a schedule, a dynamic on full display in Britain’s price-cap cycle, where each reset echoes through the annual rate exactly a year later, as our coverage of the UK inflation round traces. Tax changes work the same way: a sales tax rise lifts the annual rate for exactly twelve months, then vanishes from it overnight.
Both Directions, and How to See Them Coming
Base effects flatter and embarrass with perfect symmetry. A high month a year ago means today’s rate is being held down or about to fall, the favorable case governments enjoy narrating as victory. A low month a year ago, a price war, an energy dip, a pandemic collapse, means today’s rate is being pushed up, and inflation can accelerate on paper while current pricing stays tame. The great confusion of 2021 began exactly there: spring 2020’s collapsed prices formed the base for spring 2021’s readings, so part of the alarming early acceleration was arithmetic, which fed a long argument about how much was echo and how much was real. Both sides of that argument were reading the same defensible numbers.
The defense is to know the calendar. Since annual rates compare against a base that is public history, every future base effect is announced a year ahead: find last year’s unusual months, and you know which upcoming releases will move for mechanical reasons. Statisticians and central banks do precisely this, publishing base-effect decompositions before the releases land. The second defense is to change the ruler. The month-on-month change, ideally annualized, or a three-month annualized average, measures current price momentum with no year-old baggage at all; when the annual rate and the three-month rate diverge sharply, the gap is usually the base talking. The construction details that make these different readings possible from one index are covered in our closer look at the CPI, and the same anniversary arithmetic applies to every measure in the family, from the GDP deflator on down.
Reading the current moment through this lens is instructive. American inflation of 3.46 percent, the rich world’s highest, carries inside it the early-2026 energy shock, which means the anniversary months of that shock are already scheduled to subtract from the annual rate as they enter the base, entirely apart from anything the Federal Reserve does. When those months arrive and headlines celebrate or claim the decline, the honest question, the one our analysis of US inflation equips a reader to ask, will be how much of the fall is current pricing and how much is the calendar collecting its scheduled debt.
The Rule That Sorts Every Case
One test separates arithmetic from economics: ask what the price level is doing now. If inflation fell but the level merely stopped rising, that is disinflation by anniversary, the shock aging out of the data, and it implies nothing about current pressure. If inflation fell because current monthly changes are small, pressure has genuinely eased. If inflation rose but the level is climbing no faster than before, look for a low base month doing the lifting. The annual rate answers “how much higher are prices than a year ago,” which is a real and useful question, but it is a question about a twelve-month window, not about this month, and treating it as a live pressure gauge is the root of nearly every base-effect confusion. Levels for the burden, monthly momentum for the pressure, annual rates for the year as a whole: three questions, three rulers, and most of the seasonal noise in inflation commentary comes from using the third ruler to answer the second question.
MASEconomics Explains
3 economic concepts behind base effects
These concepts are explored in depth across our educational articles library.
Explore the MASEconomics BlogConclusion
Base effects inflation readings are what happen when a twelve-month ruler is mistaken for a live gauge: the annual rate moves because its far end slid across last year’s shocks, and disinflation or acceleration gets reported that no shopper can feel. The mechanics are a single sentence, the jump ages out, the rate steps down, and the consequences recur every cycle, from oil-shock anniversaries to tax-change echoes to the scripted cliffs of regulated tariffs.
The remedies are equally compact. Know last year’s calendar, and every mechanical move is forecastable to the month. Check the monthly momentum when the annual rate and intuition disagree. And keep the level in view, because it is the level, not the rate, that measures what the accumulated inflation has done to a household’s money. Statistics reward readers who know what question each number answers, and few numbers are misread as reliably as an annual rate on the anniversary of a shock.
Frequently Asked Questions
What are base effects in inflation data?
Base effects are movements in the annual inflation rate caused by the twelve-month-ago comparison month changing, rather than by anything happening to current prices. When a past price shock reaches its first anniversary it drops out of the comparison, and the annual rate falls mechanically; an unusually low month a year ago raises it the same way.
Why can inflation fall without prices falling?
Because the annual rate measures the change over twelve months, not the level. If prices jumped a year ago and have been flat since, the annual rate stays high until the jump ages out, then drops sharply even though nothing got cheaper. The price level, and the cost of living, remain exactly where the shock left them.
How can you spot a base effect in advance?
Look at the calendar of last year’s unusual months, since they form the bases for the coming year’s readings. A shock month twelve months back means the annual rate will fall on its anniversary; a depressed month means the rate will rise. Central banks and statistical agencies publish these decompositions ahead of the releases.
Do base effects also push inflation up?
Yes, symmetrically. If prices a year ago were unusually low, after a price collapse or an energy dip, today’s annual comparison starts from a depressed base and reads high even when current pricing is calm. The early-2021 acceleration included exactly this echo of spring 2020’s collapsed prices.
Which inflation measures avoid base effects?
Measures with shorter windows: the month-on-month change, usually annualized, and three- or six-month annualized averages. They capture current price momentum without the year-old comparison, at the cost of more noise, which is why analysts read them alongside the annual rate rather than instead of it.
Thanks for reading! Every shock schedules its own disappearance from the data twelve months ahead, and knowing the schedule is most of the trick. Happy learning with MASEconomics