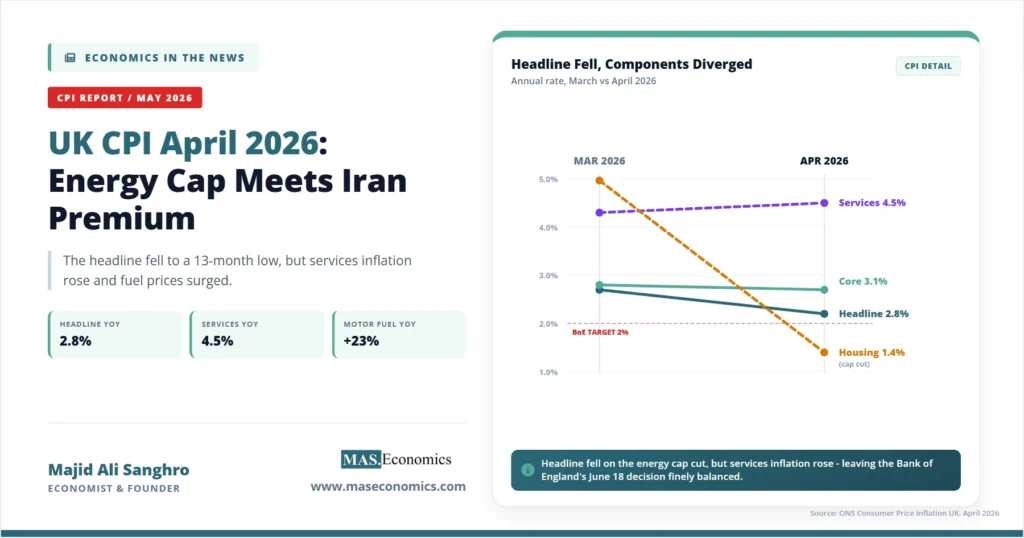
The Office for National Statistics released April’s UK CPI data on Wednesday, May 20, and the headline number told a story that was easy to misread. Annual consumer price inflation fell to 2.8% in April 2026, down from 3.3% in March and below the market consensus of 3.0%. On the front page of any newspaper, that looks like a decisive win. The Bank of England’s 2% target finally feels within reach, and households got their first month of relief in nearly half a year. The market reaction was immediate: investors cut their bets on further Bank of England rate hikes, sterling softened slightly, and gilt yields fell across the curve.
The composition of the print, however, tells a very different story. The headline fell because of one large administrative change to a single category. Underneath, the components that the Monetary Policy Committee actually watches when it sets policy are still moving in the wrong direction. Services inflation rose. Motor fuel inflation surged. Inflation expectations remain unanchored. The April print is not a turning point. It is a moment of administrative arithmetic on top of an inflation problem that has not been solved.
The Energy Price Cap Cut
The single largest force behind April’s headline fall was the Ofgem energy price cap, which dropped by 7% on April 1. The cap is the maximum unit price suppliers can charge most domestic customers in England, Wales, and Scotland on standard variable tariffs, and it is reset every three months on the basis of wholesale gas and electricity prices over a preceding twelve-week window. Because the cap covers roughly twenty-two million households and is reflected directly in the CPI’s electricity and gas indices, every quarterly reset moves the headline number mechanically.
The April reset was unusually large. Electricity prices in the twelve months to April 2026 fell by 8.4%, compared with a rise of 2.9% a year earlier. That single move pulled the entire housing and household services category from 5.3% annual inflation in March to 1.4% in April, a drop of 3.9 percentage points in a single month. Because housing and household services carry the largest weight in the CPI basket, that one shift was enough to push the headline number down by almost half a percentage point on its own.
The drop reflects an earlier collapse in wholesale gas and electricity prices during the assessment window Ofgem uses, before the Iran conflict reignited oil and gas volatility in late February. In other words, the April cap cut is a delayed echo of last winter’s mild weather and weak European industrial demand, not a signal about current pressures. By the time the next cap reset arrives in July, the Iran premium on wholesale energy is likely to be feeding through in the opposite direction.
Three other categories moved with the headline. Food and non-alcoholic beverages inflation eased from 3.7% to 3.0%, partly because of supermarket discounting and partly because base effects from last spring’s food shock dropped out of the annual comparison. Recreation and culture eased from 2.8% to 1.7%. Health price inflation fell from 3.1% to 2.4%. Together with the energy cap, these four categories account for almost the entire move in the headline.
Rising Services and Fuel Inflation
Outside the energy cap effect, the inflation picture deteriorated. The most striking number in the April release was motor fuel: prices rose 23% in the twelve months to April, the highest annual increase since September 2022. Petrol pump prices climbed roughly 8.6 pence per litre between March and April alone, and diesel rose more sharply still. This is the direct UK transmission of the Iran-Hormuz oil shock, which pushed Brent crude from the mid-$70s in February to above $115 in late March, before settling in the high $90s by the time of the April CPI survey.
Motor fuel is a small component of the CPI basket on its own, but its second-round effects are large. Almost every service that involves transportation, delivery, or fuel-intensive inputs is now absorbing higher costs, and businesses have begun to pass them through. The April services PMI release for April, taken at the same time as the inflation survey, showed input prices rising at their highest pace since mid-2022 and output prices at their highest since January 2023 (Yahoo Finance, May 2026). Economists tracking the underlying services data suggested the PMI signal was consistent with services inflation accelerating toward 6% on a sustained basis, materially higher than the 4.5% ONS print.
That official services CPI figure deserves a closer look. Services inflation rose from 4.3% in March to 4.5% in April. Services is the component the Bank of England weighs most heavily in its policy reasoning because services prices are less exposed to global commodity swings and more dependent on domestic labour costs, rent, and inflation expectations. Service prices are also stickier than goods prices, meaning that once they begin to rise, they tend to keep rising for longer. A 4.5% services print is more than double the 2% target. A rising 4.5% services print, in the middle of an oil shock, is a problem that monetary policy cannot ignore.

The Composition of the April Print
| Component | April 2026 (annual) | March 2026 (annual) | Direction |
|---|---|---|---|
| CPI (headline) | 2.8% | 3.3% | Down 0.5 pp |
| CPIH (headline with housing) | 3.0% | 3.4% | Down 0.4 pp |
| Core CPI (excl. food and energy) | 3.1% (Mar latest) | 3.2% (Feb) | Slow easing |
| Services | 4.5% | 4.3% | Up 0.2 pp |
| Housing and household services | 1.4% | 5.3% | Down 3.9 pp (cap cut) |
| Electricity | −8.4% | +2.9% (year earlier) | Sharp fall |
| Motor fuel | +23% | ~+10% trend | Sharp rise (Iran) |
| Food and non-alcoholic beverages | 3.0% | 3.7% | Down 0.7 pp |
|
Source: ONS, Consumer Price Inflation, UK: April 2026 (released May 20, 2026).
|
|||
The Headline’s Misleading Signal
Inflation indices are weighted averages, and the headline number can move sharply for reasons that have nothing to do with underlying price dynamics. The April release is a textbook case. If the Ofgem cap had not changed, the headline would have come in roughly where the market expected, around 3.2% to 3.3%. The disinflation everyone is celebrating is almost entirely the arithmetic of one regulated price moving down by 7%, multiplied by the heavy weight that energy carries in the housing services category.
This is why the Bank of England talks publicly about “underlying” or “core” inflation and why analysts strip out the volatile components when assessing the direction of policy. The mechanics here resemble what the United States is experiencing in reverse. In the US, April CPI rose to 3.8%, the highest annual rate since May 2023, with energy and gasoline driving roughly forty per cent of the gain (CNBC, May 2026). On both sides of the Atlantic, the same oil shock is showing up in the data. The headline numbers diverge because of regulatory and base-effect differences, not because the underlying inflation dynamics are pulling apart.
The deeper similarity is the service’s story. US core CPI rose to 2.8%, with services less energy services running at 3.3%. UK services inflation is at 4.5%. In both economies, the sticky, labour-cost-driven component of inflation is the binding constraint on rate cuts. The headline number is the part that the public reacts to. The number of services is the part that the central bank reacts to.
The Bank of England’s June 18 Decision
The Monetary Policy Committee meets on Thursday, June 18, four weeks after the April CPI release. The Bank Rate currently sits at 3.75%, where it has been held since the December 2025 cut, after the MPC paused its cutting cycle in response to the Iran shock. At the April 30 meeting, the Committee voted 8-1 to hold, with one member preferring an increase to 4%. That single dissent matters: it is the first time in this tightening cycle that a Committee member has voted to raise rates in response to a supply-driven price shock rather than a demand-driven one.
The April CPI print does not resolve the MPC’s dilemma. It deepens it. The Committee can now point to a fall in the headline as evidence that policy is working, even though the fall is administrative. At the same time, services inflation is moving higher, motor fuel is feeding through to business input costs, and inflation expectations are unanchored. The Bank’s April Monetary Policy Report acknowledged that underlying consumer services inflation remains elevated, and that higher non-labour input costs are expected to slow the services disinflation process. The DMP survey showed business price expectations rising sharply after the Iran conflict began, with one-year-ahead CPI expectations climbing to 3.5% and the volatile single-month measure jumping to 4.0%.
The wider context matters. The UK economy is running with chronically low productivity growth, a structurally tight labour market, and a fiscal stance that is constrained by high public debt service costs. Pay growth, while slowing, is still well above what is consistent with 2% inflation: regular wages excluding bonuses rose 3.4% in cash terms in the three months to March, and average weekly earnings rose 4.1% including bonuses, against real annual growth of around 0.3% to 1.0%. Real wages are growing only because inflation has eased; nominal wage settlements have not yet adjusted to a lower inflation regime. As long as services inflation stays above 4%, nominal wage demands will lag.
This is the textbook environment in which the short-run Phillips trade-off becomes politically painful. The labour market is cooling. Payrolled employment fell by 100,000 between March and April, vacancies are at their lowest level since 2021, and the unemployment rate is drifting up, but the cooling is not yet fast enough to break services inflation. The Bank of England’s mandate is to bring inflation back to 2% sustainably, not to bring down a single month’s headline. The MPC will read the April print as good news on the surface and bad news in the composition, and act on the composition.
Data Before the June Meeting
Three data releases between now and the June decision will shape the outcome. The first is the May labour market and earnings release, due in mid-June, which will reveal whether the cooling in employment is translating into slower wage growth. The Bank takes private-sector regular pay growth as its core wage measure, and a print below 3% would meaningfully reduce the case for hiking. A print holding above 3.5% would keep the hawkish dissent alive.
The second is the May CPI release on June 17, the day before the MPC decision. May’s reading will be the first full month with the Iran fuel shock fully passing through pump prices, and the first month without the Ofgem cap reset effect. If services inflation rises again and motor fuel stays at current levels, the headline could move back up toward 3.0% or higher. That would put the Committee in the awkward position of explaining that April’s fall was a one-off while May’s rise is a trend.
The third is the path of Brent crude. The Iran conflict is now in its fourth month, with no clear off-ramp. A renewed escalation that closes or threatens the Strait of Hormuz would send oil sharply higher and erase any remaining disinflation in the UK headline. A negotiated de-escalation would do the opposite, but neither side has signalled willingness to step back.
Disinflation vs. a Falling Headline
The April print illustrates a distinction that often gets blurred in the public conversation. Disinflation refers to a fall in the underlying rate of price increases across a broad set of categories, typically driven by easing demand, slower wage growth, or improving supply conditions. A falling headline number can reflect disinflation, but it can also reflect a one-off shock to a heavily weighted component, base effects from a price spike in the comparable month a year earlier, or a regulated price change. Mistaking the second for the first is one of the most common errors in interpreting inflation data.
The April 2026 UK release falls into the second category. The components that are most informative about underlying price dynamics, such as services, wages, business price expectations, and the breadth of price increases across categories, are not improving. The fall in the headline is a snapshot, not a trend. Anyone who treats it as evidence that the inflation battle is over will be surprised by the June and July prints.
Implications for Households and Firms
Real wages turned modestly positive in May for the first time in several months, as nominal pay growth held while the headline CPI eased below wage growth. Energy bills fell from their January peaks and food price inflation moderated, arresting the acute cost‑of‑living squeeze but not reversing the accumulated loss of purchasing power. Input costs, however, rose again on the business side, pushed higher by fuel and shipping. Services PMI surveys indicated that firms were passing those costs through, while the labour market cooled without loosening enough to relieve wage pressures. Sectors dependent on transport, hospitality, and construction faced a particularly difficult mix of rising input costs, weak pricing power, and a workforce still expecting above‑inflation pay rises. Mortgage borrowers are confronted with a Bank Rate unlikely to fall before late 2026 at the earliest. Markets had priced in two cuts by year‑end before the Iran shock; after the April CPI release, they priced in none. The two‑year swap rate ticked down but stayed well above its December 2025 lows, leaving the 4% fixed‑rate mortgage as the effective floor rather than the ceiling.
The View From the Cluster
The April UK CPI release is one piece of a wider 2026 inflation pattern in which advanced economies are now diverging not because their underlying inflation problems are different, but because their administrative arrangements and energy market structures translate the same oil shock into very different headline numbers. Central banks are diverging because their headline data are diverging, but the underlying services inflation problem is shared. The Federal Reserve faces it. The European Central Bank faces it. The Bank of England faces it.
The unique feature of the UK case is the speed at which administered prices feed into the headline. The Ofgem cap, water charges, council tax, regulated rail fares, and university tuition all reset on fixed annual or quarterly schedules. This makes UK headline inflation more administratively driven than US or eurozone headline inflation, and it explains why monthly UK CPI prints can move sharply in either direction without telling you much about the underlying inflation regime. The MPC understands this. Most of the media coverage does not.
Conclusion
The UK CPI April 2026 release brought the headline rate to 2.8%, its lowest level in more than a year, and the natural temptation is to treat that as the end of the inflation story. The mechanics of the print say otherwise. Almost the entire move came from a single administrative change to the energy price cap. Underneath the headline, services inflation rose, motor fuel inflation surged to a four‑year high, and business inflation expectations climbed in response to the Iran shock. The Bank of England will read the data with that decomposition in mind and is unlikely to be moved by the headline alone.
The deeper lesson is one that recurs in every inflation cycle. Headline numbers are easy to celebrate or panic about because they are single, prominent figures. The information that determines the path of monetary policy lies in the composition. The April release looked like a victory and was, in substance, a continuation of the same problem. The June 18 MPC decision will turn on what the May data show, not on what the April headline appeared to say.
MASEconomics Explains
Three ideas behind the April UK CPI print
Explore more analysis of inflation, central bank decisions, and the global economic backdrop.
Explore the MASEconomics BlogThanks for reading! If you found this helpful, share it with friends and spread the knowledge. Happy learning with MASEconomics