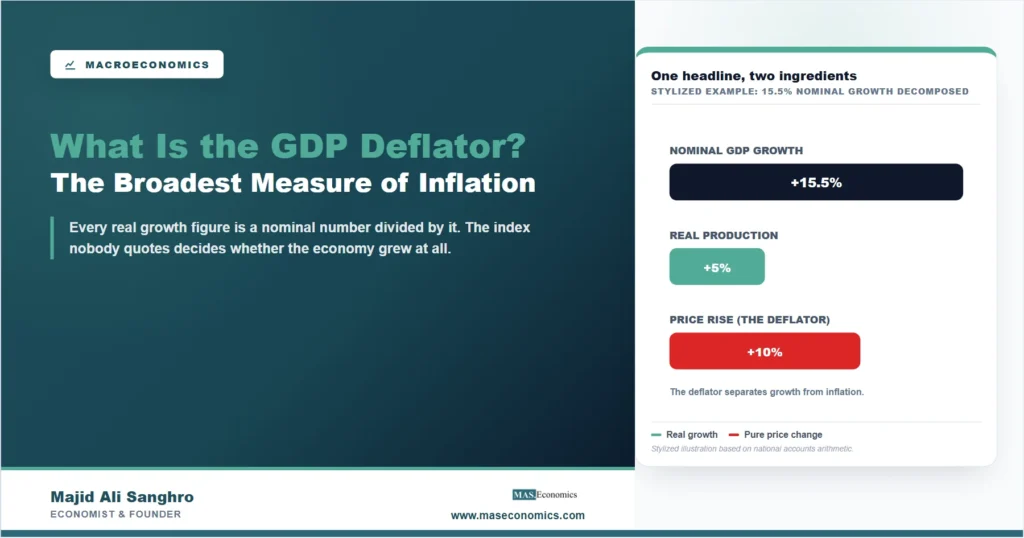
A country’s nominal GDP can rise ten percent in a year while the economy produces not one additional car, haircut, or line of software. Higher prices alone can do all of the work. Separating the part of GDP growth that is real production from the part that is pure price rise requires an inflation measure built for the whole economy, and that is the GDP deflator: the ratio of GDP at current prices to GDP at constant prices, covering every final good and service the economy produces. The consumer price index gets the headlines and the pay negotiations. The deflator quietly decides something larger, because every real growth figure a government ever announces is a nominal number divided by it.
That division gives the deflator unusual leverage. Overstate it and a growing economy looks stagnant; understate it and stagnation is reported as growth. Debt-to-GDP ratios, productivity statistics, and cross-country league tables all inherit whatever the deflator gets right or wrong, which is why an index most people never quote is worth understanding in its own right.
The Division Inside Every Growth Headline
The deflator is defined by one ratio:
Nominal GDP values this year’s production at this year’s prices. Real GDP values the same production at the prices of a chosen base period, so that only quantities can move it. The distinction between the two, set out in our guide to real vs nominal measures, is the whole trick: since the two figures describe identical output, any gap between them can only be price change.
A stylized economy makes the arithmetic concrete. Suppose it produces 100 units of one good. In the base year the price is $1, so nominal and real GDP are both $100 and the deflator is 100. The next year output rises to 105 units and the price to $1.10. Nominal GDP is $115.50; real GDP, at base-year prices, is $105. The deflator is 115.5 divided by 105, times 100, which is 110. The economy grew 5 percent, prices rose 10 percent, and the 15.5 percent nominal headline was a compound of the two. Statistical agencies run this exact separation across millions of prices, which is how a quarterly release by the Bureau of Economic Analysis in the United States, or its counterpart anywhere else, turns raw spending totals into the growth rate that reaches the news. What that growth figure means once it arrives is the territory of our companion piece on GDP growth.
One property follows from the construction rather than from any survey decision. The deflator’s basket is whatever the economy actually produced this period. Nobody chooses it, nobody has to update it, and it can never fall out of date, because it re-forms itself every quarter around current production. An index of this type, weighted by the current period’s quantities, is called a Paasche index, and modern statistical agencies refine it further with chain weighting, updating the comparison basket every period and linking the results so that no single base year’s structure gets locked in for a decade.
What the Deflator Counts That the CPI Does Not
The consumer price index answers a household’s question: what happened to the cost of the things consumers buy? Its construction, covered in our closer look at the consumer price index, starts from a surveyed basket of consumer purchases and tracks its cost over time. The deflator answers a producer-side question instead: what happened to the price of everything the economy made? The two questions overlap where households buy domestic output, and separate everywhere else.
| Feature | GDP deflator | Consumer price index |
|---|---|---|
| Coverage | All domestically produced final goods and services: consumption, investment, government output, exports | Goods and services bought by households |
| Imports | Excluded (imports are subtracted in GDP) | Included wherever households buy them |
| Basket | Whatever was produced this period; re-forms automatically | Fixed survey basket, updated at intervals |
| Index type | Paasche-type, chain-weighted in modern practice | Laspeyres-type in most countries |
| Frequency | Quarterly, with the national accounts | Monthly |
| Typical uses | Real GDP, productivity, debt ratios, cross-country comparison | Wage indexation, benefits, rent contracts, inflation targets |

|
||
Three of those rows carry most of the practical weight. Investment goods and government output are inside the deflator and invisible to the CPI, so a construction boom or a surge in public-sector costs moves one index and not the other. Exports are inside the deflator too, because they are domestic production, even though no domestic household consumes them. And imports run the other way entirely: a television made abroad sits in the CPI basket of the country that buys it, while its price belongs to the producing country’s deflator.
When the Two Measures Tell Different Stories
In calm periods the deflator and the CPI move together closely enough that the distinction looks academic. Shocks are where it earns its keep, and the clearest case is an oil shock hitting a country that imports its energy. Imported crude is not part of that country’s production, so its price does not enter the deflator directly; it very much enters the CPI, through fuel, transport fares, and everything freight touches. The result is a wedge: households experience sharp inflation while the deflator reports a milder one, and both numbers are correct answers to their own questions. For an oil exporter the same shock runs in reverse, inflating the deflator through export prices while the CPI response depends on domestic fuel pricing. The mechanics of the 2026 oil shock made this distinction live for every energy importer at once.
The gap matters beyond description because the two indexes have different jobs. Wages, pensions, and benefits are typically indexed to the CPI, since it tracks the cost of living households face. But real GDP, the productivity numbers built on it, and the denominator of every debt-to-GDP ratio all run on the deflator. During a divergence, a government can watch its citizens’ cost of living surge while its measured real economy, deflated by the gentler index, holds up, or the reverse. Anyone comparing “inflation” across two headlines without checking which index each one uses is comparing answers to different questions, a family of traps we catalogued in conflicting economic statistics.
The United States adds one more layer: the Federal Reserve’s target is defined on yet another index, the PCE price index, which shares the deflator’s national-accounts machinery but restricts coverage to consumer spending. It sits between the two poles described here, and its differences from the CPI, explained in our piece on the PCE index, echo the same themes of coverage and weighting in a narrower arena. The full cast of measures, and which institution watches which, is mapped in inflation reports explained.
Where the Broadest Measure Falls Short
Breadth is the deflator’s strength and the source of its limits. It is not a cost-of-living measure, and using it as one misreads it: a household cannot buy a share of government output or an export shipment, so an index that includes them describes the economy’s price level, not any family’s grocery bill. Its automatic basket has a subtler cost as well. Because the weights follow current production, the deflator partly absorbs the substitutions people and firms make when relative prices move, which tends to make it read slightly lower than a fixed-basket index during inflationary periods. That is a defensible design choice, not an error, but it means the deflator and the CPI can disagree even with identical price data.
Timing and revision are the practical constraints. The deflator arrives quarterly, with the national accounts, weeks after the month-by-month CPI, and it is revised repeatedly as the underlying GDP estimates firm up, sometimes years later. A central bank that needs a fast, stable monthly signal cannot wait for it, which is one reason inflation targets worldwide are written in terms of consumer indexes instead. And in economies with large informal sectors, the deflator inherits every weakness of the GDP measurement beneath it: prices for unrecorded production are imputed, so the “broadest” measure is only as broad as the accounts that feed it, a caveat that applies with force across the developing world, where the World Bank’s deflator series is often the only long inflation record available and carries those imputations inside it.
MASEconomics Explains
3 economic concepts behind the GDP deflator
These concepts are explored in depth across our educational articles library.
Explore the MASEconomics BlogConclusion
The GDP deflator is the inflation measure hiding inside every growth statistic: nominal GDP divided by real GDP, covering everything the economy produces and nothing it merely imports. Its basket assembles itself from current production, which spares it the fixed-basket staleness of consumer indexes at the cost of absorbing substitution, and its breadth makes it the natural deflator for real GDP, productivity, and debt ratios rather than for anyone’s cost of living.
The working rule is to match the index to the question. The cost a household faces is CPI territory; the price of what a nation produces belongs to the deflator; and a divergence between them is not a contradiction but information, usually about import prices, investment, or the public sector, the places where the two baskets part company. The measure that never makes the headline is the one every headline growth figure silently depends on, and reading it alongside the GDP figures it deflates is the simplest upgrade available to anyone who follows economic statistics.
Frequently Asked Questions
What is the GDP deflator in simple terms?
It is the ratio of nominal GDP to real GDP, multiplied by 100. Because both figures describe the same output, once at current prices and once at base-period prices, the ratio isolates pure price change across everything the economy produces. A deflator of 110 means the economy’s price level is 10 percent above the base period.
How is the GDP deflator calculated?
Statistical agencies value this period’s production twice: at the prices actually paid, giving nominal GDP, and at base-period prices, giving real GDP. The deflator is nominal divided by real, times 100. In modern practice the comparison basket is chain-weighted, meaning it updates every period and the results are linked into one continuous series.
What is the difference between the GDP deflator and CPI?
The CPI tracks the cost of a fixed basket of goods and services households buy, including imports. The deflator covers everything the economy produces, including investment, government output, and exports, and excludes imports entirely. The CPI’s basket is fixed by survey; the deflator’s re-forms automatically from current production, so the two can diverge when import prices or non-consumer sectors move sharply.
Why is the GDP deflator called the broadest measure of inflation?
Because its coverage is the entire domestic economy rather than any single sector’s purchases. Consumer indexes cover household spending, producer indexes cover firms’ output prices, but the deflator spans consumption, investment, government production, and exports at once. Anything counted in GDP is inside it, which is the widest scope an inflation measure can have.
What does a falling GDP deflator mean?
A falling deflator means the average price of domestically produced output is declining, which is deflation on the production side of the economy. It can happen while consumer prices still rise, for example when export prices collapse for a commodity producer. Persistent deflator declines usually accompany weak demand and are treated as a warning sign by central banks.
Thanks for reading! The next growth headline that crosses the screen is a division problem, and now both halves of it are visible. Happy learning with MASEconomics