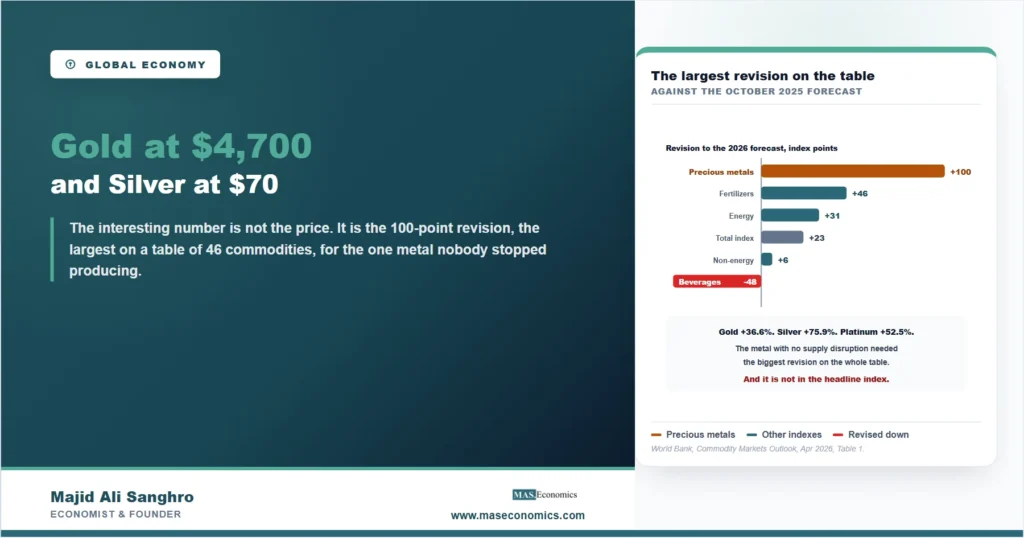
In October 2025 the World Bank published a forecast for the gold price in 2026. Six months later it published another one, and the number had moved by $1,125 an ounce. That is not a small adjustment to a projection; it is roughly a third of what gold cost when the first forecast was written. The gold price forecast now sits at $4,700 per troy ounce for 2026, up 36.6 percent from the $3,442 average of 2025, with silver at $70 an ounce and platinum at $1,950. Those three levels are the ones that will be quoted. The more informative number is the one underneath them: the precious metals index was revised up by 100.1 points from the October forecast, which is the largest revision anywhere on a table covering 46 commodities, larger than energy in the middle of the biggest oil supply shock on record. A forecast revision of that size is a statement about the forecasters and the conditions they were working in, not about the metal, and reading it that way turns a price story into something more useful.
The Biggest Revision on the Table Is Not About Gold
Set the metals against everything else the same institution revised at the same moment, and the shape of 2026 becomes visible. Energy, the sector at the center of the war, was revised up 31.4 index points. Fertilizers, where Gulf urea exports stopped outright, went up 46.4. Base metals rose 25.1 and the total commodity index 23.0. Precious metals moved 100.1, more than double the next largest change in either direction. Beverages went the other way by 48.2 as the cocoa and coffee supply crunches unwound, which is a large move and still only half the size of the precious metals revision. The point is not that gold is important. It is that when the World Bank re-estimated a table of 46 prices after a war closed a shipping lane, the line it had to move furthest was the one with no supply disruption at all. Nothing happened to gold production in March 2026. What happened was that the price of holding gold changed, because the demand for a non-interest-bearing asset with no counterparty is a demand for insurance, and the perceived probability of the thing being insured against went up. Like every asset priced off a future rather than a present, it moves on what people expect rather than on what they can currently observe. The index recorded that as a price, and the forecasters recorded their own surprise as a revision.
It Is Not a Gold Rally
The popular version of this story has gold in the lead and the other metals following, which is the reverse of what the table shows. Gold is forecast up 36.6 percent in 2026. Silver is forecast up 75.9 percent, from $39.8 to $70 an ounce, and platinum up 52.5 percent, from $1,278 to $1,950. Both beat gold, and both beat it by a wide margin. The World Bank puts gold and silver at close to four times their 2015 to 2019 averages this year, with platinum around twice that benchmark, and expects all three to set records. The gap between them is the interesting part, because gold is overwhelmingly a monetary and safe-haven asset while silver and platinum have large industrial uses, and the report attributes part of the tightness in those two to expanding industrial demand alongside the investment flows. A metal bought for fear and a metal bought for a factory are not the same asset, and when the one with a factory attached rises twice as fast, the move is not purely a flight to safety. That distinction is lost every time the coverage says “gold” and means “precious metals”, and it matters for anyone trying to read the price as a signal about what investors expect. The history of gold’s monetary role is set out in our article on how the gold standard shaped the monetary system, and the contemporary version of that argument runs through our piece on whether a gold-backed currency could challenge the dollar.
The report is also unusually frank about how little confidence to place in the numbers, and that candor belongs in any honest write-up. It describes record price volatility driven by speculative activity, notes that prices reached all-time daily highs in late January before easing over the rest of the quarter and edging down again in April, and says the projections are subject to particular uncertainty because of large swings in speculative positioning that amplify price movements. It then names the conditions under which the forecast breaks in each direction. Prices would go lower if major economies tightened monetary policy in response to renewed inflation, since a higher real interest rate raises the opportunity cost of holding an asset that pays nothing; if geopolitical tension eased and safe-haven flows softened; if central bank buying slowed after several years of exceptionally strong accumulation; or if the dollar appreciated. They would go higher on the mirror image of each. That is a forecast with its own failure conditions attached, which is the most useful form a forecast can take and the part most likely to be dropped in summary.
The Index That Leaves It Out
There is one more thing in the table, and it is in the footnotes rather than the numbers. The World Bank’s headline commodity price index, the one that produces the widely quoted figure that average commodity prices are set to rise 16 percent in 2026, is composed of energy and non-energy prices excluding precious metals. A second footnote repeats it: precious metals are not part of the non-energy index either. So the single largest price move on the table, and the single largest forecast revision, appear in neither of the aggregate numbers that will be reported as the state of commodity markets in 2026. This is not a flaw. Index construction is always a choice about what the index is for, and a commodity index built to track the cost of production inputs to the world economy has a defensible reason to exclude a metal held mainly as a store of value, whose price movements say more about portfolio decisions than about the cost of making anything. But a reader who does not know the exclusion is being told something narrower than they think.
The practical lesson generalizes well past this table, and it is the same one that catches people out with core inflation. Every headline aggregate is a weighted decision about what counts, and the things left out are left out for reasons that made sense to whoever built it and may not match the question being asked of it now. Our explainer on why central banks look through food and energy works through the same logic in a different index, and our article on how inflation erodes purchasing power shows what a household actually experiences when the aggregate and the basket diverge. The commodity index will report a 16 percent rise. Gold rose 36.6 percent and is not in it. Both statements are true, and the second one is invisible unless somebody reads footnote one.
MASEconomics Explains
3 economic concepts behind the metals move
These concepts are explored in depth across our educational articles library.
Explore the MASEconomics BlogConclusion
The World Bank’s gold price forecast for 2026 is $4,700 per troy ounce, 36.6 percent above the 2025 average, alongside silver at $70 and platinum at $1,950, with the whole precious metals index up 42.4 percent and all three metals expected to set records. The levels are the headline. Three things underneath them are more informative. The precious metals line was revised up 100.1 index points from the October 2025 forecast, the largest revision on a table of 46 commodities and more than double the next largest in either direction, on a commodity whose supply was never disrupted. Silver and platinum both rose faster than gold, by 75.9 and 52.5 percent against 36.6, which means this was not simply a flight to safety but a move with industrial demand inside it. And the headline commodity index that will be quoted as the state of the market excludes precious metals by construction, so the biggest mover of the year does not appear in it.
The report attaches its own failure conditions, and they deserve to travel with the number rather than being dropped: monetary tightening, an easing of geopolitical tension, slower central bank accumulation, or a stronger dollar would each pull the forecast down, and it already describes record volatility driven by speculative positioning that amplifies every shock. Read as a prediction, this is a fragile number by its own account. Read as a measurement of a year in which the forecasters had to move one line further than any other, and had to move it for a metal nobody stopped producing, it is a durable piece of information about what 2026 felt like to the people holding the world’s assets.
Frequently Asked Questions
What is the World Bank forecasting for gold and silver in 2026?
Gold at an average of $4,700 per troy ounce, up 36.6 percent from $3,442 in 2025, and silver at $70, up 75.9 percent from $39.8. Platinum is forecast at $1,950, up 52.5 percent. The precious metals index as a whole is forecast up 42.4 percent, with all three metals reaching records, and is expected to moderate in 2027 while staying high by historical standards.
Why is the forecast revision more interesting than the price?
Because it measures surprise rather than level. The precious metals index was revised up 100.1 points from the October 2025 forecast, the largest change on a table of 46 commodities and more than twice the next largest, on a commodity whose production was never disrupted. Energy, at the center of the supply shock, was revised up 31.4 points by comparison.
Did silver really rise more than gold?
Yes, by a wide margin in the forecast: 75.9 percent against 36.6 percent, with platinum at 52.5 percent also ahead of gold. Silver and platinum have substantial industrial uses, and the report attributes part of their tightness to expanding industrial demand alongside investment flows, so calling the episode a gold rally describes the slowest of the three.
Is gold included in the headline commodity price index?
No. The World Bank’s total commodity price index is composed of energy and non-energy prices excluding precious metals, and a separate footnote confirms precious metals are not part of the non-energy index either. So the widely quoted projection that average commodity prices rise 16 percent in 2026 does not contain the largest price move on the table.
What would make this forecast wrong?
The report names the conditions itself. Prices would fall short if major economies tightened monetary policy in response to renewed inflation, since that raises the opportunity cost of holding a non-interest-bearing asset; if geopolitical tension eased and safe-haven demand softened; if central bank buying slowed after years of strong accumulation; or if the dollar appreciated. It also warns that speculative positioning has been amplifying price swings, making the projections particularly uncertain.
Thanks for reading! The most revealing number in a price table is usually not a price but the distance between this forecast and the last one. Happy learning with MASEconomics