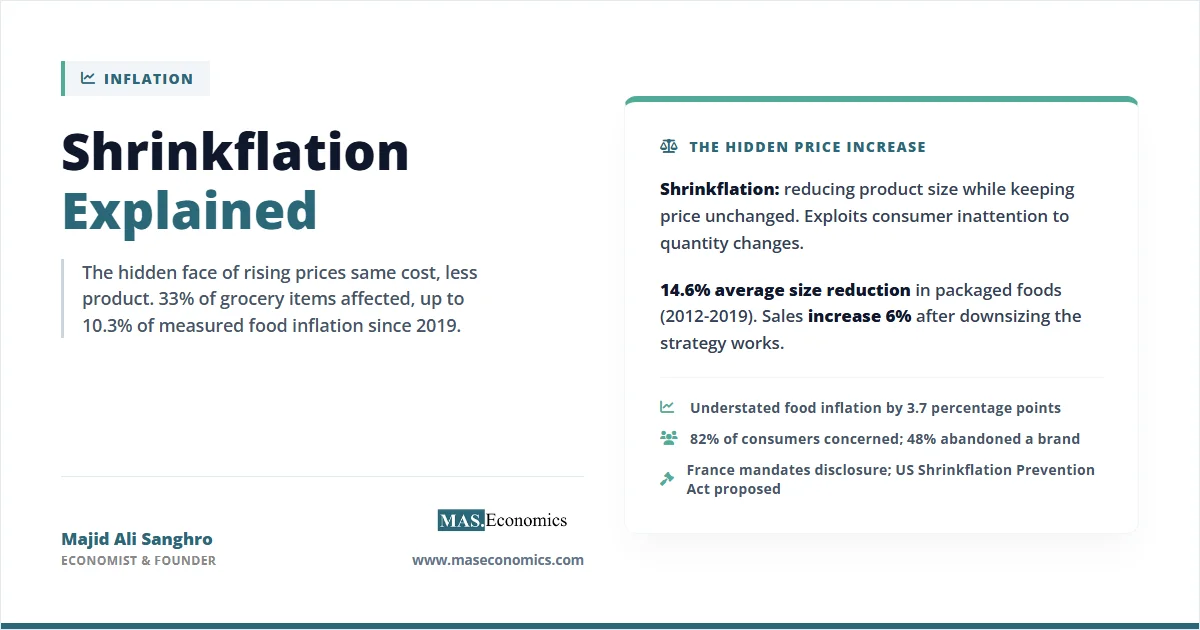
A bag of crisps that weighed 10.5 ounces last year now weighs 9 ounces. The price on the shelf has not changed. The packaging looks identical. Most shoppers will not notice the difference. But the per-unit cost has just increased by 17%, and it will never appear in a single inflation headline. This is shrinkflation explained in its simplest form: the practice of reducing product sizes while keeping prices unchanged, a strategy that has affected 33% of grocery items in the United States and driven up to 10.3% of measured grocery price inflation since 2019.
The phenomenon is not new. Manufacturers have quietly trimmed product sizes for decades. What changed after 2020 is the scale. Between 2012 and 2019, packaged food product sizes decreased by an average of 14.6%, understating food inflation by 3.7 percentage points over that period, according to a 2025 study from UMass Amherst using Bureau of Labor Statistics scanner data. In 2025 alone, major brands reduced products by as much as 50%, including one powdered drink mix that dropped from 6 packets to 4 packets without any change in price. A peer-reviewed study published in Marketing Science found that product downsizing is more than five times as prevalent as upsizing, and that sales actually increase by approximately 6% after a product is shrunk, confirming that the strategy works precisely because consumers respond more strongly to price changes than to quantity changes.
The Economics of Shrinkflation
The logic behind shrinkflation rests on a well-documented asymmetry in consumer psychology. Pricing research consistently shows that shoppers anchor on nominal prices and react sharply to visible price increases, but often overlook changes in quantity. A product jumping from $4.99 to $5.99 triggers immediate resistance and potential brand-switching. The same product shrinking 15% at $4.99 may go entirely unnoticed. Cognitive scientists call this “unit bias”: the tendency to treat identical-looking packages as containing identical amounts.
From the firm’s perspective, shrinkflation serves as a margin-preservation strategy during periods of rising input costs. When raw material prices, transportation expenses, and energy costs increase, a producer faces three options: absorb the cost increase and accept lower margins, raise the retail price and risk losing sales volume, or reduce the product quantity while maintaining the price. The third option is, in economic terms, a hidden price increase that exploits the information asymmetry between producers and consumers.
The Marketing Science study, analysing a decade of NielsenIQ retail scanner data covering millions of products across tens of thousands of US retail stores, found that approximately 1.92% of products are downsized in any given period. This may seem small, but when compounded across product categories and over time, the effect is substantial. The study concluded that “firms can raise prices through shrinkflation without substantially hurting demand,” confirming that the strategy is economically rational even if ethically questionable.
How Shrinkflation Actually Works
The pattern is remarkably consistent across product categories. Manufacturers reduce quantities in increments small enough to avoid immediate detection, often while redesigning packaging to obscure the change.
Snack foods: Chip manufacturers reduced standard bag sizes from 10 ounces to 9.5 ounces while maintaining $4.99 retail pricing. Chocolate bars decreased from 1.55 ounces to 1.48 ounces. Cookie packages dropped from 15 ounces to 13.7 ounces, a 9% reduction that translates directly into a 9% hidden price increase per unit.
Breakfast and pantry items: Cereal boxes decreased from 19.3 ounces to 18.1 ounces across several national brands. Coffee packages shrank from 12 ounces to 10.5 ounces, a 12.5% reduction. Pasta boxes shifted from 16 ounces (the traditional one-pound standard) to 14 ounces in select product lines.
Household products: Toilet paper and paper towel manufacturers reduced sheet counts per roll while maintaining roll counts per package. A package might still contain 12 rolls, but each roll has fewer sheets, resulting in less total product. One box of laundry detergent shrank 20.6%, from 88 fluid ounces to 73.
Ice cream: The shift from half-gallon containers (64 ounces) to 48 ounces, and in some cases to 46 ounces, has become one of the most widely recognized examples. The containers look similar on shelves, but families receive roughly 25 to 28% fewer servings.
A typical family purchasing 20 affected products monthly may receive 8 to 12% less total product volume for the same expenditure compared to 2024 purchases, according to Consumer Protection Journal tracking data.
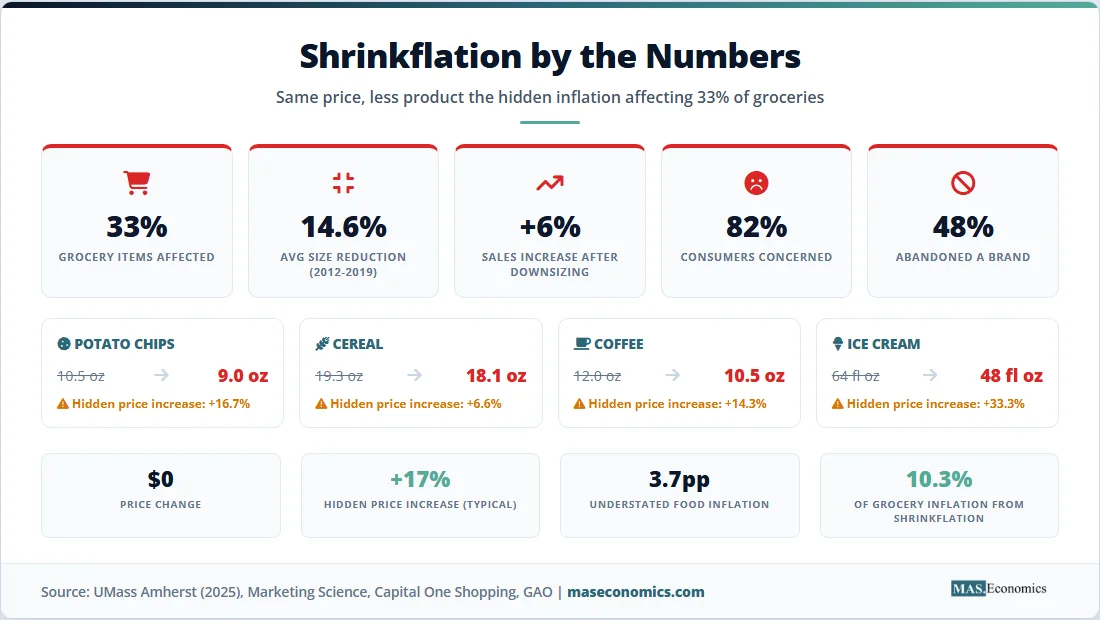
| Product Category | Old Size | New Size | Reduction | Hidden Price Increase per Unit |
|---|---|---|---|---|
| Potato chips | 10.5 oz | 9.0 oz | 14.3% | +16.7% |
| Cereal | 19.3 oz | 18.1 oz | 6.2% | +6.6% |
| Coffee | 12.0 oz | 10.5 oz | 12.5% | +14.3% |
| Ice cream | 64 fl oz | 48 fl oz | 25.0% | +33.3% |
| Detergent | 88 fl oz | 73 fl oz | 17.0% | +20.5% |
| Cookies | 15.0 oz | 13.7 oz | 8.7% | +9.5% |

|
||||
Shrinkflation and Official Inflation Measurement
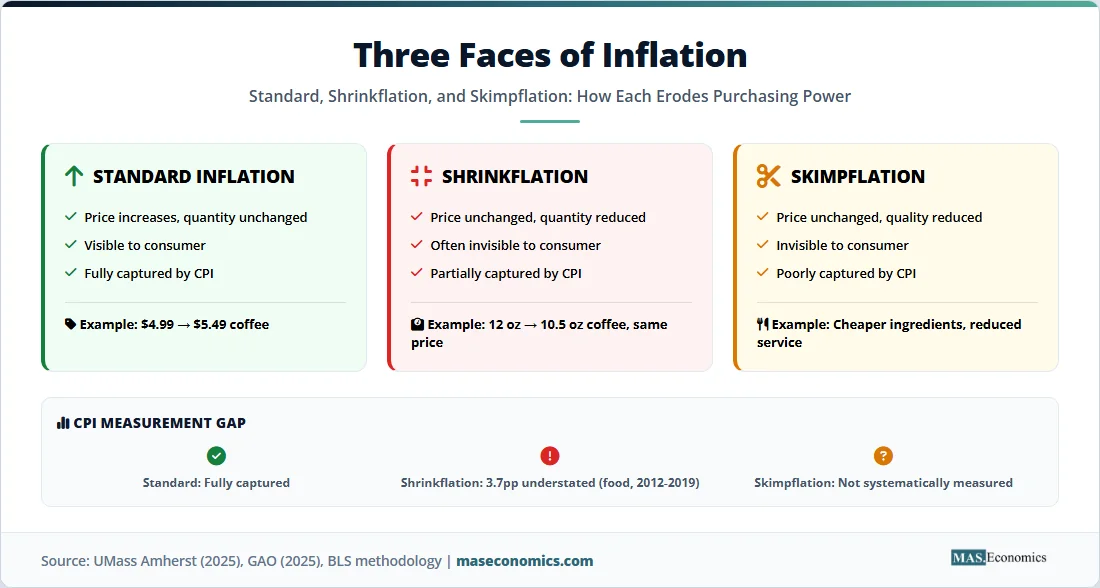
One of the most important economic questions about shrinkflation is whether official Consumer Price Index (CPI) calculations fully capture it. The answer is nuanced.
The Bureau of Labor Statistics (BLS) and the UK’s Office for National Statistics (ONS) both attempt to adjust for changes in product size through “quality adjustment” methods and scanner data analysis. When a product shrinks from 16 ounces to 14 ounces at the same price, the BLS records this as a price increase in the CPI, not as a constant price. In principle, shrinkflation is therefore captured in official inflation statistics.
In practice, these adjustments are incomplete. The US Government Accountability Office (GAO) published a comprehensive report on shrinkflation in July 2025, finding that while the overall impact on aggregate inflation is small (because many goods and services, such as housing, cannot be shrunk), the effect on specific product categories is substantial. The GAO noted that the prices of certain products, including coffee and cereal, are disproportionately affected.
The UMass Amherst study quantified the gap: packaged food sizes decreased by an average of 14.6% between 2012 and 2019, understating food inflation by 3.7 percentage points over that period. This is a significant measurement gap. If the CPI underestimates food price inflation by nearly 4 percentage points over seven years, then real purchasing power erosion is worse than the official statistics suggest, particularly for low-income households that spend a larger share of their income on food.
The Behavioural Economics of Shrinkflation
Shrinkflation is, at its core, a case study in behavioural economics. It exploits several well-documented cognitive biases.
Price Salience and Inattention
Consumers pay close attention to prices (which are prominently displayed) and much less attention to quantities (which require reading fine print). This differential in “salience” means that a 15% size reduction is informationally equivalent to a 15% price increase but is detected far less frequently. Research by Raj Chetty, Adam Looney, and Kroft demonstrated that consumers systematically underreact to less salient components of cost, a phenomenon that applies directly to shrinkflation.
Unit Bias
Consumers tend to evaluate products by the package rather than by the unit. A box of cereal is a box of cereal, regardless of whether it contains 19.3 or 18.1 ounces. This bias is reinforced by consistent packaging design: manufacturers deliberately maintain the same box dimensions, graphic layout, and shelf placement, making the size change invisible to rapid visual assessment.
The Resignation Effect
A striking finding from recent survey data is that consumer concern about shrinkflation is rising, but behavioural response is falling. A 2025 YouGov survey found that 80% of UK adults are “very” or “fairly” concerned about shrinkflation, up from 75% in 2023. Yet brand-switching intent fell from 50% in 2023 to 36% in 2025. Researchers call this the “resignation effect”: consumers are aware of the practice but feel powerless to avoid it because it is widespread across brands. This creates a collective action problem where no individual consumer’s switching behaviour is sufficient to discipline any single firm.
Skimpflation
Related to shrinkflation is “skimpflation,” the reduction in quality or service rather than quantity. Hotels that eliminate daily housekeeping, airlines that reduce legroom, restaurants that substitute cheaper ingredients, and software companies that move features behind premium paywalls are all engaging in skimpflation. The economic logic is identical: reduce the value delivered to the consumer while maintaining the nominal price.
Skimpflation is even harder to measure than shrinkflation because quality is inherently subjective and difficult to quantify in standard inflation indices. The BLS uses hedonic quality adjustment methods to account for quality changes in goods like electronics and automobiles, but these methods are poorly suited to capturing the replacement of a premium ingredient with a cheaper substitute or the elimination of a customer service channel.
From Awareness to Regulation
Governments have begun responding to shrinkflation with varying degrees of urgency.
France became the first country to introduce mandatory shrinkflation disclosure in July 2024. Major supermarket chains, including Carrefour and Intermarché, now post notices on affected products, alerting consumers to size reductions. Early evidence suggests this has increased price transparency, though its effect on purchasing behaviour remains under study.
The United States has taken a legislative approach. In February 2024, nine U.S. senators co-sponsored the Shrinkflation Prevention Act, which would empower the Federal Trade Commission to define shrinkflation as an unfair or deceptive practice and bring enforcement actions against companies that downsize products without adequate disclosure. The bill has not been enacted as of early 2026, but it signals growing political attention to the issue.
The GAO’s July 2025 report examined several policy options. Requiring labels on downsized products could increase transparency, but the agency noted enforcement challenges: determining which size changes are significant enough to require notification, establishing baseline sizes, and monitoring compliance across millions of products would impose substantial administrative costs.
Existing regulations require accurate quantity statements on all consumer packaging, and most US states mandate unit pricing (price per ounce, sheet, or count) on shelf labels. However, the visibility and formatting of unit prices vary widely, and research consistently shows that most consumers do not compare unit prices when making routine purchases.
Who Gets Hurt Most
Shrinkflation is not distributionally neutral. Its effects fall disproportionately on lower-income households and larger families.
Low-income households spend a larger share of their income on food and household goods, precisely the categories most affected by shrinkflation. When a family earning $35,000 per year pays the same amount for 12% less product across their regular shopping basket, the effective inflation rate they experience exceeds the official CPI by a meaningful margin. A family earning $150,000, whose food spending represents a much smaller budget share, is affected proportionally less.
Larger families are also disproportionately impacted because they consume more units of affected products. A household of five buying cereal, snacks, cleaning supplies, and paper products in bulk faces a compounding effect: each individual product contains less, and the total reduction across a full weekly shop can be substantial.
This distributional pattern has led some economists to describe shrinkflation as a regressive pricing strategy, one that effectively imposes a higher proportional cost on those least able to absorb it, echoing the distributional dynamics of regressive taxation.
Source: BLS, UMass Amherst (2026), GAO (2025), Consumer Protection Journal (2025) | MASEconomics.com
The chart reveals a critical insight: the hidden price increase per unit consistently exceeds the size reduction itself. A 25% size reduction in ice cream translates into a 33% per-unit price increase, because the maths of shrinkflation is non-linear. When a 64-ounce container becomes 48 ounces at the same price, the cost per ounce rises from \( \frac{P}{64} \) to \( \frac{P}{48} \), an increase of exactly \( \frac{64}{48} – 1 = 33.3\% \). This mathematical relationship means shrinkflation always hits harder than the headline reduction suggests.
MASEconomics Explains
Four concepts behind the economics of shrinkflation
Shrinkflation
The practice of reducing a product’s size, weight, or quantity while maintaining the same retail price. It functions as a hidden price increase that exploits consumers’ greater sensitivity to price changes than to quantity changes. Approximately 33% of US grocery items have been affected since 2019.
Price Salience
The degree to which a cost component is visible and attention-grabbing to consumers. Prices displayed on shelf tags are highly salient; quantities printed in small text on packaging are low-salience. Shrinkflation exploits this asymmetry by altering the low-salience dimension of value.
Quality-Adjusted Pricing
The method used by statistical agencies to account for changes in product quality or quantity when measuring inflation. When a product shrinks, the BLS records the per-unit price increase in the CPI. However, research suggests these adjustments understate the true impact, particularly for food products.
Information Asymmetry
A situation where one party in a transaction has more or better information than the other. Shrinkflation is a textbook case: manufacturers know the exact size reduction, but consumers typically do not notice it, resulting in a market outcome that departs from the predictions of perfect competition.
Conclusion
Shrinkflation, explained in economic terms, is a rational pricing strategy that exploits a measurable asymmetry in consumer cognition: people notice price changes but overlook quantity changes. The data confirms its scale: 33% of US grocery items affected, an average 14.6% reduction in packaged food sizes between 2012 and 2019, and a 3.7 percentage point understatement of food inflation over that period. The strategy works because sales increase by 6% after downsizing, even as 82% of consumers report concern about the practice.
The distributional consequences are significant. Shrinkflation functions as a regressive cost increase that falls hardest on lower-income households and larger families. Its partial escape from official inflation measurement means that the real erosion of purchasing power for food-dependent households is worse than headline CPI figures suggest. France’s mandatory disclosure law and the proposed US Shrinkflation Prevention Act represent early attempts to address the information asymmetry at the heart of the practice, but enforcement remains a challenge across millions of products and thousands of brands.
The mathematical relationship between size reduction and per-unit price increase ensures that shrinkflation always hits harder than it appears. A 25% reduction creates a 33% price increase. A 15% reduction creates an 18% price increase. As long as this gap between perception and reality persists, shrinkflation will remain one of the most effective and least visible mechanisms through which inflation erodes household purchasing power.
Did you find this article helpful? Share it with someone who loves economics. And remember, at MASEconomics, we make complex ideas simple.