The Consumer Price Index rose 2.4% in the United States over the past year, a figure central banks view as near their target. Over the same period, the S&P 500 gained roughly 15%, median U.S. home prices climbed 6%, and Bitcoin doubled. Something is inflating rapidly, yet the headline inflation gauge barely registers it. This gap between measured consumer prices and the surging cost of owning wealth is the phenomenon economists call asset price inflation, and it has become one of the most consequential blind spots in modern macroeconomic policy.
Asset price inflation refers to sustained increases in the prices of stocks, bonds, real estate, and other stores of wealth, distinct from the rising cost of the everyday goods and services tracked by the Consumer Price Index. While a loaf of bread costs a few percent more each year, the house next door may appreciate by double digits, and an index fund by more still. Understanding why these two worlds diverge, and what that divergence means for households, central banks, and financial stability, requires unpacking how inflation is measured and what official statistics deliberately leave out.
What Is Asset Price Inflation?
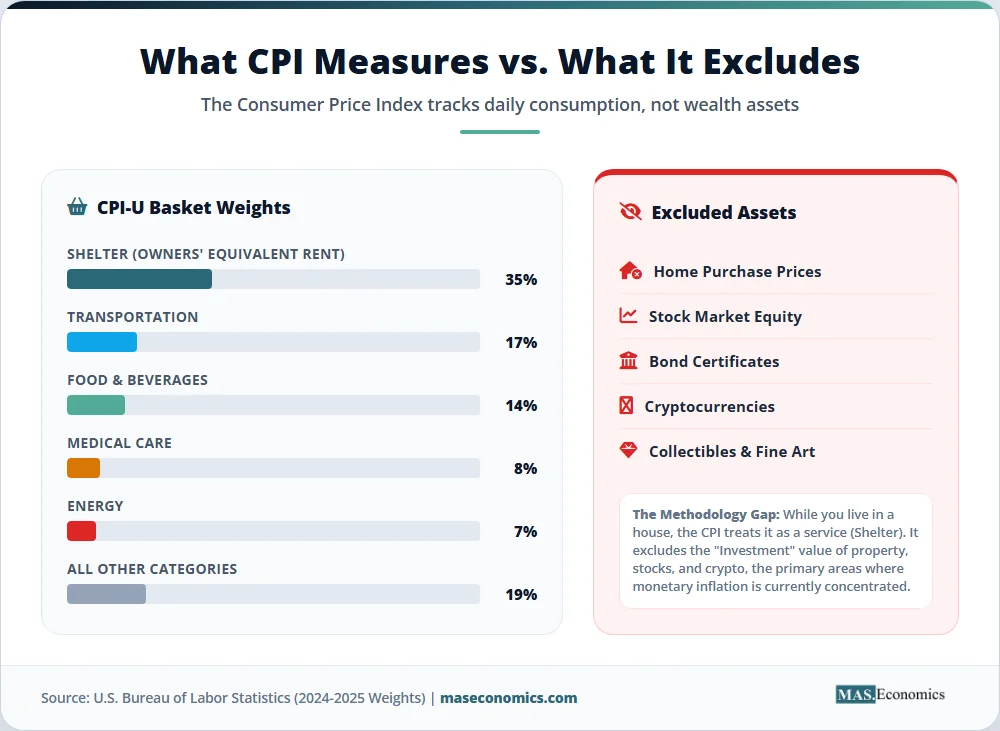
Consumer price inflation and asset price inflation describe two different economic processes, even though both involve rising prices. The CPI tracks a representative basket of goods and services that households purchase for consumption: food, energy, apparel, transportation, medical care, recreation, and shelter services. Its purpose is to measure changes in the cost of living, the amount of money a typical household must spend to maintain a given standard of consumption.
Asset price inflation measures something categorically different. When the price of a share of Apple stock rises, no consumption has occurred, and no standard of living has changed. What has risen is the market valuation of a claim on future income streams. The same applies to a rental property, a government bond, a piece of farmland, or a cryptocurrency token. These are stores of value and productive claims, purchased not for immediate use but for the returns they are expected to generate or the wealth they preserve.
The distinction matters because the economic implications differ sharply. A rise in grocery prices directly reduces household purchasing power. A rise in the S&P 500 does the opposite for those who own equities, increasing their paper wealth. Yet both reflect more money chasing a limited supply of something, and both can be driven by the same underlying monetary conditions. For a general introduction to how inflation works, see our guide on inflation simply explained.
Why CPI Excludes Asset Prices
The exclusion of asset prices from the CPI is not an oversight. It reflects a deliberate methodological choice made by statistical agencies around the world, grounded in the distinction between consumption and investment. The Bureau of Labor Statistics, which compiles the U.S. CPI, defines its mandate as measuring the prices of goods and services that households buy for current consumption. Assets, by definition, are not consumed.
Housing
Housing is the most economically significant example of this methodological choice. Shelter accounts for roughly 35% of the CPI basket, making it the largest single category. But the BLS does not track home purchase prices. Instead, it uses a measure called Owners’ Equivalent Rent, which estimates what homeowners would pay in rent if they were leasing their own homes. This approach attempts to isolate the consumption value of housing, the flow of shelter services, from its investment value, the appreciation of the underlying asset.
The rationale is sound in principle. When a family buys a house, part of their payment purchases shelter, and part purchases an asset. Capturing only the shelter component keeps the CPI focused on the cost of living. In practice, this means that a housing market boom can leave CPI shelter inflation relatively subdued even as home prices surge. Case-Shiller home price data showed U.S. home values rising roughly 40% between 2020 and 2022, while the CPI shelter component rose about 12% over the same span.
Stocks, Bonds, and Cryptocurrencies
Financial assets are excluded from the CPI for the same reason. A share of stock represents ownership of future corporate earnings. A bond represents a claim on future interest and principal payments. Neither is consumed, and their price changes reflect shifts in expected returns, discount rates, and risk premia rather than the cost of living.
Cryptocurrencies occupy a murkier category. Some proponents treat them as a medium of exchange, which would suggest inclusion in a consumer basket. In practice, the overwhelming majority of cryptocurrency transactions are speculative, and statistical agencies classify them as financial assets. The result is that a 100% annual rise in Bitcoin has no direct effect on measured inflation, even though it represents a substantial transfer of purchasing power toward holders of those tokens.
Twenty Years of Divergence
The divergence between consumer prices and asset prices over the past two decades illustrates the scale of the gap. Between 2005 and 2025, U.S. CPI roughly doubled, a cumulative increase of about 65%. Over the same period, the S&P 500 total return index rose by more than 400%, and the Case-Shiller National Home Price Index rose by approximately 120%. Someone whose income was tied to inflation-adjusted wages experienced one economic reality. Someone whose wealth was tied to equities and real estate experienced another entirely.
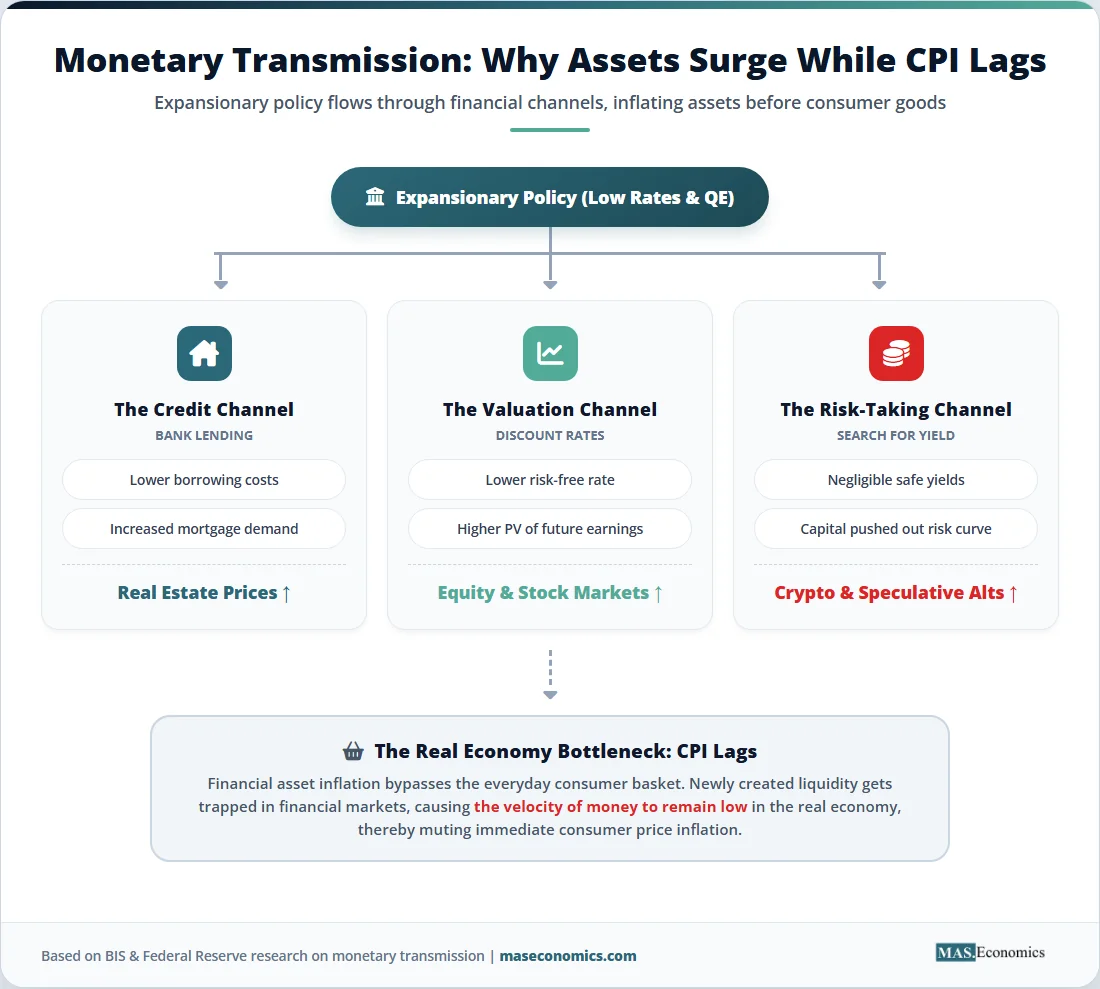
This pattern intensified after the 2008 financial crisis and again during the pandemic. In both episodes, central banks responded to economic weakness with aggressive monetary easing, cutting interest rates to near zero and purchasing trillions of dollars of financial assets through quantitative easing. The stated goal was to support employment and prevent deflation. One consequence, widely acknowledged by the central banks themselves, was a sharp rise in asset prices. Lower discount rates mechanically increase the present value of future cash flows, and abundant liquidity flowed into equities, real estate, and eventually into more speculative assets.
Charting the Divergence
The chart below tracks the divergence between consumer prices and two key asset categories over the past twenty years, with all three series indexed to 100 in 2005.
Source: Federal Reserve Economic Data (FRED), S&P Case-Shiller U.S. National Home Price Index, S&P 500 Total Return Index, and U.S. Bureau of Labor Statistics CPI-U. All series indexed to 100 in January 2005.
The visual tells a stark story. CPI traces a gentle upward slope, reflecting the steady erosion of purchasing power that inflation-targeting central banks aim to keep modest. Home prices show a boom-bust-boom pattern, collapsing during the 2008 crisis and surging after pandemic-era policy support. Equities exhibit the most dramatic trajectory, with cumulative gains that dwarf the rise in consumer prices. A household whose financial position depended on wages tracked the red line. A household whose wealth was concentrated in equities tracked the teal line. The gap between those two lines is a rough measure of how much asset price inflation reshaped the distribution of economic outcomes.
Central Banks and Asset Prices
Central banks have traditionally resisted incorporating asset prices directly into their policy frameworks, preferring to target consumer price inflation. The rationale, articulated most prominently by former Federal Reserve Chair Alan Greenspan and later refined by Ben Bernanke, is that identifying asset bubbles in real time is extraordinarily difficult, and that using interest rates to pop suspected bubbles risks unnecessary damage to employment and output. Under this view, the appropriate response is to clean up after a bubble bursts rather than try to prevent it.
This doctrine has been contested, particularly after the 2008 crisis demonstrated the macroeconomic damage that collapsing asset prices can inflict. The Bank for International Settlements has been the most consistent critic, arguing that financial stability risks deserve greater weight in monetary policy decisions. For the broader institutional context, see our guide on central banking and monetary policy. The table below summarises how major central banks formally treat asset prices.
| Central Bank | Formal Mandate | Treatment of Asset Prices |
|---|---|---|
| Federal Reserve (U.S.) | Dual mandate: price stability and maximum employment | Monitors asset prices for financial stability signals but does not target them. Uses macroprudential tools rather than rates. |
| European Central Bank | Primary: price stability (2% inflation). Secondary: support EU economic policy | Publishes Financial Stability Review; asset prices enter through macroprudential policy, not the main policy rate. |
| Bank of England | Price stability (2% CPI) with financial stability role via the FPC | Financial Policy Committee addresses asset-price risks directly; Monetary Policy Committee focuses on CPI. |
| Bank of Japan | Price stability (2% inflation) | Exceptional case: purchases equity ETFs and real-estate trusts directly, making asset prices a live policy variable. |
| Reserve Bank of Australia | Price stability (2–3% band), full employment, welfare of the people | Explicit attention to housing market in policy statements; uses macroprudential coordination with APRA. |
| Bank for International Settlements | Not a central bank; coordinates among them | Consistently argues for leaning against asset-price booms to prevent financial stability crises. |

|
||
Consequences of the CPI Blind Spot
Three significant consequences flow from the gap between measured consumer inflation and actual asset price inflation. Each reshapes the economy in ways that traditional policy frameworks struggle to capture.
Wealth Inequality
The most immediate consequence is distributional. Asset ownership in advanced economies is highly concentrated. According to Federal Reserve Survey of Consumer Finances data, the top 10% of U.S. households own approximately 87% of directly and indirectly held equities, and the top 1% alone own more than half. Homeownership is more broadly distributed but still skewed toward older and higher-income households. When asset prices rise faster than wages and consumer prices, the wealth gap widens mechanically, even in the absence of any change in underlying productivity or effort.
This dynamic has been documented extensively by the IMF and World Inequality Database researchers. The share of national wealth held by the top 1% in the United States has risen substantially since the 1980s, with a significant portion of the increase traceable to asset price appreciation rather than labour income gains.
Monetary Policy Blind Spots
A central bank that targets CPI may conclude that its policy is well-calibrated even as asset prices surge unsustainably. This creates a real risk of prolonged monetary accommodation that inflates asset bubbles while consumer prices remain quiescent. The decade following the 2008 crisis offered a textbook example. CPI inflation consistently undershot the Fed’s 2% target, which the FOMC cited as justification for maintaining near-zero rates and continuing asset purchases. Meanwhile, equity valuations, house prices, and a range of alternative assets reached historic highs.
Financial Stability Risks
The most dangerous consequence is the accumulation of financial fragility. When asset prices rise on the back of easy credit and low discount rates, the inevitable correction can cascade through balance sheets, triggering forced selling, bank distress, and recession. The 2008 crisis originated in a housing bubble that CPI data entirely missed. Subsequent BIS research has argued that financial cycles typically run longer and deeper than business cycles, and that a CPI-only framework is structurally insufficient to detect them in time.
What Asset Price Inflation Cannot Fully Explain?
Despite its importance, asset price inflation is not a complete theory of everything that has gone wrong in modern economies. Several caveats deserve attention. First, rising asset prices reflect not only monetary conditions but also genuine economic fundamentals: productivity gains in the technology sector, demographic demand for retirement savings, and long-term declines in real interest rates driven by factors beyond central bank control. Distinguishing bubbles from fundamentals is genuinely hard, which is part of why central banks have been reluctant to target asset prices.
Second, concepts of “true inflation” that simply average CPI with asset price changes can be misleading. A doubling of stock prices does not reduce the purchasing power of wages in the same way that a doubling of grocery prices does. The two phenomena require separate analytical treatment, not forced aggregation into a single number.
Third, some apparent asset inflation reflects compositional changes in the asset universe itself. The S&P 500 of 2025 contains a very different mix of companies, with different profit profiles, than the S&P 500 of 2005. Part of the observed index gain reflects the rising share of high-margin technology firms rather than pure price inflation of a fixed basket.
MASEconomics Explains
4 economic concepts behind asset price inflation
Conclusion
Asset price inflation captures a dimension of economic reality that the Consumer Price Index was never designed to measure. The CPI does its intended job well: tracking the cost of living for a representative household. But a household’s economic position depends not only on the price of groceries but also on the value of its home, its retirement portfolio, and the broader asset markets that shape wealth accumulation. When these two worlds diverge for extended periods, the result is distributional strain, monetary policy ambiguity, and accumulated financial fragility. Recognising asset price inflation as a distinct phenomenon, rather than a footnote to headline inflation, is a necessary step toward policy frameworks that reflect the full economic picture.
Did you find this article helpful? Share it with someone who loves economics. And remember, at MASEconomics, we make complex ideas simple.