Poland spends more on defense as a share of its economy than any other NATO member. Between 2021 and 2025 it took defense from 2.2 percent of GDP to an estimated 4.5 percent in cash terms, reaching $46.7 billion and the fifth-largest military outlay in Europe, and it roughly doubled its standing forces from 116,200 to 233,800 without conscription, giving it the largest standing military in the European Union. If military spending were the growth engine it is often assumed to be, that should be visible in the data. The IMF’s April 2026 World Economic Outlook reports that the macroeconomic impact of Poland’s buildup has so far been muted. Understanding why is the most useful thing anyone can take from the current wave of rearmament, because the defense spending multiplier is not a fixed property of military budgets. It is a range running from about 0.7 to above 1, and which end a country lands on depends on three decisions, only one of which usually gets discussed.
The Multiplier Is a Range, Not a Number
The Fund’s estimates come from two directions that broadly agree. Historically, a study of 164 countries since the end of the Second World War finds that governments have frequently run sizable defense spending booms, mostly financed through borrowing, and that in peacetime these raise output and prices in the short term, especially when the increase is permanent rather than temporary. Given the average size and length of those peacetime booms, the report concludes the pattern is consistent with a multiplier above 1, and in episodes tied to a permanent increase, real GDP rises by more than 5 percent over five years. That sentence is worth quoting carefully, because it is the corrected one: the IMF issued an errata on 22 April 2026 replacing the original third sentence of that paragraph and updating the data behind the chapter’s opening figure. Anyone working from the version published on 8 April is quoting a sentence the Fund has since withdrawn, which is a small reminder that a report is a moving object for weeks after it appears.
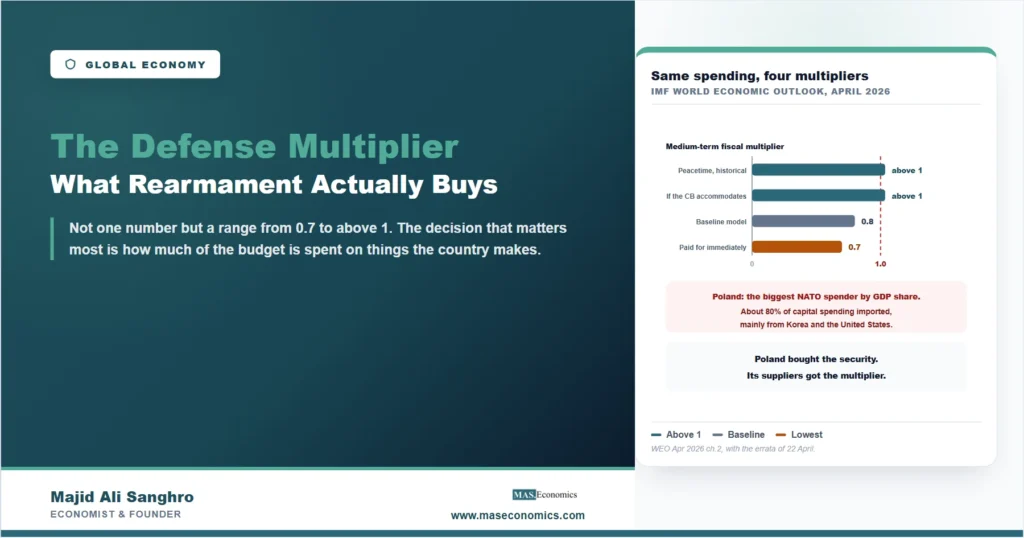
The model-based estimates are more sober and more useful, because they separate out what a government actually controls. The baseline simulation produces a medium-term fiscal multiplier slightly below unity, about 0.8, which the Fund notes sits within the range the European Central Bank has recently produced from its own models. From there the scenarios move in both directions. If the central bank accommodates the spending rather than raising rates against the resulting growth and price pressure, the demand effect is larger and the multiplier rises above 1, but core inflation spikes by half a percentage point and the current account deteriorates by half a point of GDP despite a weaker exchange rate. If instead fiscal policy moves quickly to pay for the buildup, implementing offsetting measures immediately to hold down public debt, the debt path is far more comfortable and the multiplier falls to about 0.7, because the offsetting measures themselves reduce demand. There is no setting in which a country gets the large multiplier, the contained debt and the stable inflation together, which is the trade-off our guide to fiscal policy objectives works through. The arithmetic that links these choices is the subject of our guide to the fiscal multiplier, and its derivation in our piece on the Keynesian cross.
Poland Bought the Security. Its Suppliers Got the Multiplier.
The third decision is the one Poland illustrates, and it is barely mentioned in the political debate. Poland’s increase was driven by equipment rather than personnel: equipment spending rose from 0.7 percent to 2.4 percent of GDP and now accounts for more than half of total defense outlays, the highest such share in NATO. Given the lack of domestic capacity, that surge was met largely through imports, which private estimates put at around 80 percent of total capital spending, particularly from Korea and the United States. This is where the multiplier goes. When defense spending is directed toward imported equipment, as the Fund notes for Denmark and Poland alike, a substantial share of the demand stimulus accrues to foreign producers rather than to domestic value added, which dampens the response of domestic output and employment. Poland has bought a great deal of security and a large standing army. The orders, the production runs and the payroll effects attached to the hardware landed in Korean and American factories.
This is a leakage in the plainest sense. Money spent on an import leaves the domestic circular flow at the moment it is spent, so it cannot go round again as somebody’s wage and somebody else’s revenue, which is exactly the loop a multiplier describes. The Fund’s own scenario work confirms the mechanism from the other side: in the scenario where offsetting measures come quickly, the current account improves in the medium term specifically because of reduced import leakages. The point generalizes well past defense. Any stimulus spent on things a country does not make is a smaller stimulus than its headline suggests, which is why the composition of a spending package predicts its domestic effect better than its size does. It also explains an apparent contradiction in the Polish numbers. Total public spending rose by 6.5 percent of GDP in accrual terms between 2021 and 2025, of which defense was about 2 percentage points, and the broader fiscal expansion did contribute to growth. The defense component specifically did not do much, because it was highly import intensive. Two facts that look inconsistent in a headline are consistent once the import share is known.
What the Buildup Costs Elsewhere
The financing side carries its own consequences, and the report is direct about them. Defense booms are mostly financed through borrowing, and Poland is a clean example: with public debt initially low at 48 percent of GDP in 2022 and ready access to financing, the increase was funded almost entirely by a wider deficit. That is a defensible choice from a low starting point and it is not free. To the degree that looser fiscal policy did lift domestic demand, the Fund notes it likely produced a tighter monetary policy path than would otherwise have been seen, so part of the cost was paid by every borrower in the economy through interest rates rather than by the government through taxes, which is the coordination problem set out in our piece on how the two policies work together. Firm-level evidence in the same chapter points the same way: spending booms deliver larger demand effects to defense-related sectors and boost their investment, but they can crowd out private investment when they come with a debt buildup, which is the standard mechanism our guide to budget balances sits on top of and which our article on what high public debt does to rate cuts follows into the present.
Two further findings deserve to travel with any discussion of rearmament. Defense spending booms often weaken both fiscal and external balances, the external side because equipment imports widen the current account deficit, a channel our explainer on the balance of payments sets out in general terms. And booms occurring in wartime, as opposed to peacetime, are followed by sharp increases in public debt and large reductions in social spending, which is the guns-versus-butter trade-off in its literal historical form rather than as a classroom phrase. The current wave differs from past episodes in ways the Fund flags carefully: today’s outlays are more capital and R&D intensive, and they are happening in economies that are more integrated into world trade and more indebted than in previous buildups. More integrated means more leakage, since a globalized supply chain is precisely what allows the equipment to be bought abroad. More indebted means less room to borrow the cost. Both of those cut the same way, and both suggest the multiplier from this buildup will sit at the lower end of the historical range unless governments deliberately do something about the import share.
MASEconomics Explains
3 economic concepts behind the buildup
These concepts are explored in depth across our educational articles library.
Explore the MASEconomics BlogConclusion
The defense spending multiplier is not one number and treating it as one is how the current rearmament debate goes wrong. The IMF’s April 2026 analysis puts the baseline at about 0.8 over the medium term, rising above 1 if the central bank accommodates the spending, and falling to roughly 0.7 if the government pays for it immediately with offsetting measures. Historically, peacetime booms across 164 countries since 1945 are consistent with a multiplier above 1, and the largest gains come where the increase is permanent rather than temporary, with real GDP up more than 5 percent over five years in those episodes. Those are wide bounds, and a government’s own choices about monetary accommodation and financing speed determine where inside them it lands.
The decision that gets least attention matters most, and Poland is the case that shows it. The biggest defense spender in NATO as a share of GDP has seen a muted macroeconomic impact, because equipment is more than half its defense budget and roughly 80 percent of that capital spending was imported, largely from Korea and the United States. The stimulus went where the factories are. That is not an argument against the spending, which was undertaken for security rather than for growth, and it is a warning against expecting the growth as a bonus. It also sets the honest test for every country now raising its defense budget: not how much is being spent, but how much of it is spent on things the country makes. A buildup financed by borrowing, delivered through imports, in an economy that is more indebted and more integrated than in any previous cycle, will produce security and very little else. Wanting it to produce industrial capacity as well is a legitimate aim, and it requires a deliberate policy rather than an assumption.
Frequently Asked Questions
What is the multiplier on defense spending?
There is no single value. The IMF’s April 2026 baseline model gives a medium-term fiscal multiplier of about 0.8, which rises above 1 when monetary policy accommodates the spending and falls to about 0.7 when the government implements offsetting measures immediately. Historical peacetime booms across 164 countries are consistent with a multiplier above 1.
Why did Poland’s large buildup have a muted economic effect?
Because most of it was spent abroad. Equipment rose from 0.7 to 2.4 percent of GDP and now exceeds half of Poland’s defense outlays, the highest share in NATO, and private estimates put imports at around 80 percent of total capital spending, mainly from Korea and the United States. Demand directed at imported equipment accrues to foreign producers rather than to domestic output and employment.
Does military spending crowd out private investment?
It can, when it comes with a debt buildup. The report’s firm-level evidence shows spending booms deliver larger demand effects to defense-related sectors and boost their investment, while crowding out private investment where the spending is associated with rising debt. In Poland’s case, looser fiscal policy also likely produced a tighter monetary policy path than would otherwise have applied.
How is the current rearmament different from past buildups?
The IMF flags three differences. Today’s defense outlays are more capital and research intensive; the economies doing the spending are more integrated into world trade, which makes it easier to buy equipment abroad and therefore increases leakage; and they are more indebted, which limits how much of the cost can be borrowed. All three point toward a smaller domestic effect than historical averages suggest.
Is the guns versus butter trade-off real?
In wartime, measurably so. The report finds that defense spending booms occurring in wartime are followed by sharp increases in public debt and large reductions in social spending. Peacetime booms behave differently and are mostly financed through borrowing rather than by cutting other programs, which defers the trade-off rather than removing it.
Thanks for reading! The honest test of a defense budget is not how large it is but how much of it is spent on things the country actually makes. Happy learning with MASEconomics