In 2016, the American Statistical Association warned that a p-value alone does not measure the credibility of a finding. In economics, the standard threshold of p < 0.05 remains widely used, but its reliability erodes when unreported analytical choices shape the final result. p-hacking occurs when researchers, consciously or unconsciously, search across data decisions, model specifications, sample restrictions, variable definitions, or reporting choices until a statistically significant result appears.
In economics, the risk is especially serious because empirical work often involves complex datasets, imperfect measurement, policy variation, nonrandom samples, and many plausible ways to define the same research question. A labor-market study might choose among wages, earnings, employment, hours, or participation. A policy evaluation might test several treatment windows, comparison groups, controls, subgroups, and outcome definitions. Each choice may look reasonable on its own. The problem arises when the final published model hides the size of the choice set behind it.
Significance from Multiple Choices
Standard hypothesis testing begins with a clear null hypothesis, a test statistic, and a rule for deciding whether the evidence is surprising under the null. The usual convention says that \(p < 0.05\) is statistically significant. Under a single correctly specified test, that convention means that a true null hypothesis would be rejected about 5 percent of the time.
That interpretation changes when the researcher tries many versions of the analysis and reports only the successful one. If 20 independent tests are run under true null hypotheses, the probability that at least one produces \(p < 0.05\) is no longer 5 percent. It is:
This equation is a simplified illustration. Real empirical work is messier because tests are often correlated, models are not perfectly independent, and decisions are not always made mechanically. Still, the intuition is clear: repeated specification search turns a small error probability into a much larger one.
This is why p-hacking is not only a technical issue. It is a research-design problem. It affects how economists define questions, plan analyses, interpret uncertainty, and decide which findings deserve trust. A finding that survives transparent design choices is different from a finding that appears only after enough analytical flexibility.
Forking Paths Before Regression
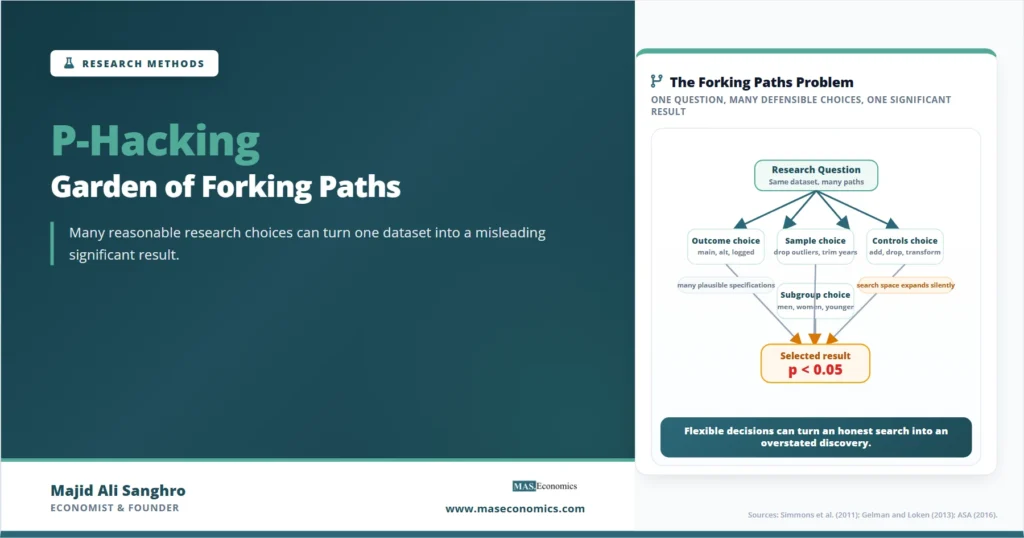
Many readers associate p-hacking with running many regressions until one result becomes significant. That is one form, but the pathway often begins earlier. The first fork may be the dataset. The next may be the sample period. Another may be the outcome variable. Another may be the control set. Another may be the treatment definition. By the time the regression table appears, many invisible decisions have already shaped the result.
Consider a study asking whether a job-training program raises earnings. The researcher must decide whether to measure annual earnings, monthly earnings, hourly wages, employment status, or total household income. The sample could include all eligible workers, only program participants, only workers observed for the full follow-up period, or only workers in a specific age group. The treatment window could be six months, one year, or two years after enrollment. None of these choices is automatically wrong. The danger appears when the researcher lets the data decide and reports the most favorable path as if it had been chosen in advance.
| Research choice | Example fork | Risk for inference | Credibility safeguard |
|---|---|---|---|
| Outcome definition | Earnings, wages, employment, hours | One outcome may look significant by chance | Pre-specify primary and secondary outcomes |
| Sample restriction | All workers versus full-record workers | Selection changes the estimated effect | Report full-sample and restricted-sample results |
| Control variables | Minimal controls versus rich controls | Significance may depend on one control set | Explain the preferred specification before results |
| Time window | Six-month versus two-year effects | Short-run noise may be mistaken for impact | Link the window to a theory of adjustment |
| Subgroup analysis | Gender, age, region, income group | Many subgroup tests create false discoveries | Treat exploratory subgroups as exploratory |
| Functional form | Levels, logs, ratios, winsorized values | Transformation choices may drive the result | Show sensitivity across defensible forms |
|
Source: MASEconomics editorial synthesis based on research-design literature on researcher degrees of freedom and specification searching.

|
|||
The table matters because p-hacking is often a pattern of ordinary decisions rather than a single suspicious act. A careful research methods workflow makes those decisions visible before the results are known.
P-Hacking vs Fraud
Fraud means fabricating, falsifying, or deliberately misrepresenting evidence. P-hacking is usually subtler. It can happen when a researcher wants to be careful, tries several plausible models, and gradually becomes attached to the version that produces a clean result. The final paper may be honest about the reported regression, but silent about the many alternatives that were tried and abandoned.
Simmons, Nelson, and Simonsohn gave this problem a clear name in “False-Positive Psychology”. Their central warning applies well beyond psychology: undisclosed flexibility in data collection, analysis, and reporting can make false-positive findings much more likely than the nominal significance level suggests.
Gelman and Loken’s garden of forking paths argument pushes the point further. A researcher does not need to run hundreds of models in a deliberate fishing expedition. Data-dependent choices can create a multiple-comparisons problem even when the final paper presents one clean analysis. The problem is not only how many regressions were run. It is how many regressions could reasonably have been run, given the data and the question.
Caveat. Exploratory analysis is valuable when labeled honestly. The credibility problem begins when exploratory choices are presented as if they were confirmatory tests planned before seeing the data.
Economics and Specification Search
Economics research often studies large systems that cannot be fully controlled by the researcher. Households, firms, governments, schools, banks, and markets respond to incentives, institutions, shocks, and expectations. That complexity creates many reasonable modeling choices.
A study of minimum wages might compare counties, states, cities, age groups, or sectors. It might use employment levels, employment growth, teen employment, restaurant employment, or hours worked. It might include local trends, industry controls, or region-by-year fixed effects. A study of trade exposure might use import penetration, tariff changes, industry classifications, commuting zones, or firm-level exposure. Each choice can be defensible. The concern is not that economists make choices. The concern is that the published paper may not reveal how much those choices mattered.
This is where the Research Methods lane differs from a purely econometrics discussion. Econometrics asks whether an estimator, test, or model is technically appropriate. Research design asks whether the full chain of decisions makes the evidence credible. A regression coefficient can be calculated correctly and still be fragile because the design relied on too many unreported forks.
Published evidence in economics has shown signs of this pressure. In “Star Wars: The Empirics Strike Back”, Brodeur, Lé, Sangnier, and Zylberberg examined p-values in leading economics journals and documented patterns consistent with bunching around conventional significance thresholds. The finding does not prove misconduct in any individual paper. It does suggest that publication incentives and analytical flexibility can shape the reported evidence base.
P-Value as Filter
The American Statistical Association’s statement on p-values warned against treating statistical significance as a mechanical proof of a scientific claim. A p-value does not measure the probability that the null hypothesis is true. It does not measure the size or policy relevance of an effect. It does not rescue a weak design.
For economic research, this distinction is essential. A coefficient can be statistically significant but economically small. It can be statistically significant because the sample is huge. It can be statistically significant because the model was selected after many alternatives. It can also be statistically insignificant in an underpowered study even when the true effect is meaningful. That is why power analysis, effect sizes, confidence intervals, and design credibility must sit beside p-values.
A better reading of a p-value starts with the research question. Was the primary hypothesis defined before seeing the data? Was the main outcome selected in advance? Are the model choices connected to theory rather than convenience? Were alternative specifications disclosed? Are multiple outcomes and subgroups treated with caution? These questions do not eliminate uncertainty, but they prevent the p-value from carrying more weight than it can bear.
Pathway to One Headline
The following pathway shows how a research project can move from a broad question to a single significant result without making the specification search visible. The visual is stylized because the exact sequence differs across studies. Its purpose is to make the hidden choice set concrete.
Credibility Through Design
The strongest protection against p-hacking is not a single statistical correction. It is a research culture that separates confirmatory analysis from exploration. Confirmatory analysis tests a hypothesis that was specified before looking at the results. Exploratory analysis searches for patterns that may generate new hypotheses. Both can be useful, but they answer different questions.
Pre-registration and pre-analysis plans are important because they record the intended path before the researcher sees the outcome data. A good plan states the primary hypothesis, treatment definition, main outcomes, sample criteria, model structure, and adjustment for multiple testing. It does not prevent learning from the data, but it makes clear which results were planned and which were discovered later.
Transparency also depends on reporting sensitivity. If a result appears only with one control set, one sample restriction, or one outcome transformation, readers should know that. A finding that holds across defensible alternatives deserves more confidence than one that vanishes when a reasonable choice changes. This is closely related to internal and external validity: design credibility depends on whether the estimate is believable in the studied setting and whether the conclusion travels beyond it.
Replication materials are another safeguard. A clean data file, codebook, cleaning script, and analysis script allow other researchers to reconstruct the path from raw data to final tables. They also make it easier to detect whether the published result depends on hidden exclusions or fragile transformations. This is why the replication crisis is not only about failed replications. It is also about whether published findings provide enough information to be checked.
Valid Specification Search
Economic data are noisy, and no single model is automatically correct. Researchers often need to test whether results are sensitive to reasonable alternatives. That kind of sensitivity analysis is not p-hacking when it is reported honestly. In fact, it is one of the ways credible research earns trust.
The distinction lies in the purpose and presentation. A sensitivity check asks whether a preferred design survives plausible changes. P-hacking searches across choices until one version passes a threshold and then presents that version as the main result. The same regression can be useful or misleading depending on where it sits in the research process.
For example, suppose a researcher studies the effect of a scholarship program on college completion. It is sensible to report results with and without baseline controls, or to test whether attrition changes the conclusion. It becomes misleading if the researcher tries many outcome windows, many subgroups, and many sample restrictions, then highlights only the one significant result without disclosing the search.
This is why the scientific method in economics requires a disciplined loop between theory, design, evidence, and revision. The data should inform learning, but the data should not quietly rewrite the hypothesis after the fact.
Evaluating Empirical Papers
Readers do not need access to every private decision a researcher made, but they should look for signs that the design was disciplined. The first sign is a clear primary outcome. When a paper reports many outcomes with equal emphasis, the chance of false positives rises. The second sign is a justified sample. Exclusions should be explained by the design, not by their effect on significance.
The third sign is a stable preferred specification. A paper can include alternative models, but the main specification should be tied to theory, institutional knowledge, or a stated identification strategy. The fourth sign is honest uncertainty. Confidence intervals, effect sizes, and null results should be treated as information, not as obstacles to a clean story.
The fifth sign is connection to the broader evidence base. A single significant estimate is rarely decisive. Meta-analysis, replication, and systematic review help distinguish durable patterns from isolated findings. When many small studies test many outcomes and only significant results are visible, the literature itself can become p-hacked even if no individual author intended to mislead.
Reducing False Positives
Good design does not remove uncertainty. It makes uncertainty legible. Several practices help reduce p-hacking risk in applied economics.
First, define the main test before the data are inspected. A pre-specified primary outcome is more credible than an outcome chosen after reviewing many possibilities. Second, separate confirmatory and exploratory results. Exploratory findings can be valuable, but they should be framed as hypotheses for future testing. Third, report the full outcome family where possible, not only the successful cell.
Fourth, use multiple-testing adjustments when many related outcomes or subgroups are examined. The right adjustment depends on the design, but the principle is simple: the more chances a study has to find significance, the more carefully the reader should interpret a single significant result. Fifth, publish code and documentation so others can reproduce the analysis. Sixth, evaluate economic significance alongside statistical significance. A tiny effect with a low p-value may not matter for policy.
These safeguards align with broader policy evaluation methods. In randomized trials, difference-in-differences designs, synthetic control studies, and causal inference more generally, the question is not only whether a number is significant. The question is whether the design justifies interpreting the number as evidence.
Explains
Three concepts behind credible empirical research
Build a stronger foundation in research design, evidence credibility, and applied empirical economics.
Explore the MASEconomics BlogConclusion
p-hacking is a problem because it makes fragile findings look stronger than they are. The issue is not that researchers make choices. All empirical work requires choices. The issue is that undisclosed flexibility changes the meaning of statistical significance. A p-value below 0.05 is not the same thing when it comes from one planned test and when it comes from a long sequence of unreported forks.
The garden of forking paths shows why the problem can arise even without conscious manipulation. Data-dependent decisions about outcomes, samples, controls, timing, subgroups, and transformations can create false positives when only the final path is visible. In economics, where datasets are complex and policy questions are high stakes, this risk deserves careful attention.
The practical answer is not to abandon statistical testing. It is to make research design more transparent. Pre-analysis plans, sensitivity checks, replication files, multiple-testing discipline, and clear separation between exploratory and confirmatory results help readers judge evidence more accurately. Good empirical research does not hide the path. It shows how the conclusion was reached.
Frequently Asked Questions
What is p-hacking in simple terms?
P-hacking is the practice of searching across many analytical choices until a statistically significant result appears, then presenting that result as if it came from one planned test.
Is p-hacking always intentional?
No. P-hacking can be deliberate, but it can also arise from ordinary data-dependent decisions. The garden of forking paths explains how false positives can appear even when researchers do not consciously fish for results.
Why does p-hacking matter in economics?
Economics research often informs policy. If statistically significant findings are produced by hidden specification search, policymakers may overreact to evidence that is less credible than it appears.
How is p-hacking different from publication bias?
P-hacking happens during analysis and reporting, when choices are made to obtain significance. Publication bias happens when significant findings are more likely to be published than null findings. The two problems often reinforce each other.
How can researchers reduce p-hacking?
Researchers can reduce p-hacking by pre-registering hypotheses, defining primary outcomes in advance, reporting sensitivity checks, adjusting for multiple testing, sharing replication files, and labeling exploratory results clearly.
What is an example of p-hacking?
A researcher tests whether a training programme raised wages and the coefficient is not significant. They then try log wages instead of levels, drop the top one per cent as outliers, add region controls, restrict to full time workers, and split by gender. One of those runs returns a coefficient significant at five per cent for men, and that is the specification reported. Nothing in the paper is false, but the reader never learns that twenty combinations were tried, so the stated p-value is meaningless as a measure of how surprising the result is.
Thanks for reading! If you found this helpful, share it with friends and spread the knowledge. Happy learning with MASEconomics