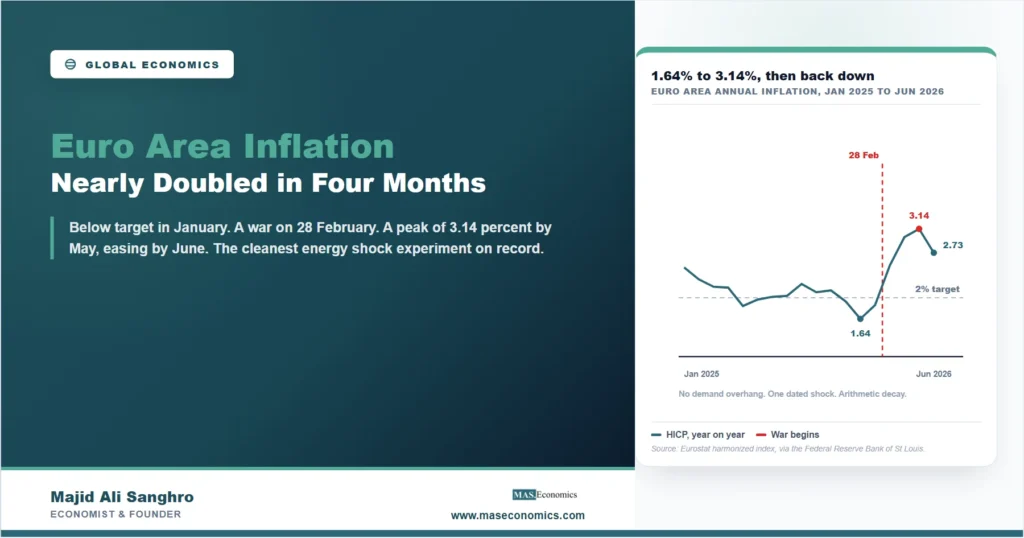
In January 2026, euro area inflation stood at 1.64 percent, below the European Central Bank’s 2 percent target and drifting down. By May it was 3.14 percent. Nothing about European demand changed in between: no stimulus arrived, no wage explosion, no borrowing boom. What changed was dated to a single week. The war that began on 28 February sent Brent crude from around $72 to $118 within a month, and the price of energy walked through the euro area’s shops, fuel pumps, and utility bills on a timetable visible month by month in the official statistics.
That timing is what makes this episode worth a close look rather than a shrug. Inflation stories usually arrive tangled: demand and supply move together, policy shifts mid-stream, and economists argue for years about attribution. This one arrived clean. An economy starting below target, hit by an external price shock on a known date, with the response laid out in monthly steps and the reversal already underway. It is the nearest thing to a laboratory demonstration of an energy shock that the statistics of a major economy can offer.
The Path, Month by Month
The euro area entered 2026 with inflation not just tame but softening: roughly 2 percent through most of 2025, 1.93 percent in December, 1.64 in January. February’s reading of 1.87 percent still belongs to the old world, since the war began on the month’s final day. Then the steps: 2.53 percent in March, 3.00 in April, 3.14 in May. Four months from the shock to the peak, with about a point and a half added to the annual rate. June printed 2.73 percent, the first step back down, as the initial jump in fuel prices began to fall out of the monthly comparisons.
Reading the steps tells you how an energy shock actually propagates. March’s jump is almost pure fuel: petrol and diesel reprice within days of the crude market, and household energy tariffs follow where contracts allow. April and May add the second round, freight surcharges, airfares, and the energy component inside every manufactured good and delivered service. The peak arrives not when oil peaks but a couple of months later, when the slower-moving prices finish catching up. And then, mechanically, the annual rate starts to fall: by June the comparison month is closer to the new price level, and unless energy rises again, each month of stable prices subtracts from the twelve-month figure. The reversal requires no policy triumph. It is arithmetic.
Why This Episode Is So Unusually Clean
Three features separate this from the inflation of 2021 and 2022, and each matters for how much can be learned. First, the starting point rules out the usual counterargument. In 2021 economists argued endlessly about whether pandemic stimulus or supply chains drove prices, because both were operating at once. In January 2026 the euro area was below target with no stimulus in sight; there is no demand overhang to argue about. Second, the shock is dated to a day, 28 February, which turns the monthly statistics into a before-and-after experiment. Third, the euro area imports nearly all its oil and much of its gas, so the shock arrives purely as a cost, unmixed with the income gains an energy producer would enjoy.
The result is a measured answer to a question textbooks usually answer with a diagram: what does a large energy shock do to a big, mature economy that was minding its own business? About a point and a half on annual inflation, front-loaded over four months, with decay beginning as soon as the level stops rising. The 2026 oil shock did plenty of other damage, but as a price event in Europe it behaved exactly as the mechanism says it should, on a faster clock than most would have guessed.
The policy side of the experiment is just as instructive. The European Central Bank, whose framework and decision machinery are covered in our profile of the ECB, did not chase the spike with emergency tightening. A central bank cannot un-price crude oil; what it can do is prevent a one-off level shift from becoming a wage-price spiral, which is a battle fought in inflation expectations rather than in this month’s index. The June easing, arriving with the deposit rate still at 2.25 percent, is early evidence that the bet is holding: the shock is passing through the numbers rather than settling into them.
The Same Shock, Different Economies
The experiment gains force from its control group, because the same barrel of oil hit everyone. The United Kingdom, which took the shock on top of an energy price cap cycle examined in our UK inflation coverage, peaked in March and has eased since. The United States, the most energy-intensive rich consumer economy, sits at 3.46 percent, the highest inflation in the rich world; but as our analysis of US inflation found, only about four tenths of the US-euro gap is energy at all, and the larger share is underlying inflation the shock merely sits on top of. The euro area is the clean case precisely because it started below target: what you see in Figure 1 is the shock, the whole shock, and little else.
One caution belongs in any honest reading. The euro area aggregate is an average across economies whose national inflation rates differ by more than two points, just as their labor markets diverge in ways we measured in one currency, four economies. The average tells the truth about the area; it does not describe any single country’s checkout counter. And the decay now underway assumes energy prices hold. A second leg of the oil shock would restart the clock, and the below-target starting point that made this episode so legible has already been spent.
MASEconomics Explains
3 economic concepts behind this inflation episode
These concepts are explored in depth across our educational articles library.
Explore the MASEconomics BlogConclusion
Euro area inflation went from 1.64 percent in January 2026 to 3.14 percent in May because a war began on 28 February and Europe buys its energy abroad. Stated that way the episode sounds unremarkable, and that is precisely its value: an external shock hit an economy with no demand pressure, added about a point and a half to the annual rate over four months, and began to fade the moment the price level stopped climbing, all of it legible in the monthly index of a single statistical agency.
Episodes this clean are rare, and they earn their keep as benchmarks. The next time inflation and growth and policy move together and the attribution fight begins, the euro area’s 2026 experiment stands as the measured answer to at least one question: this is what an energy shock alone looks like, this is how fast it arrives, and this is how it leaves.
Frequently Asked Questions
How is euro area inflation measured?
Through the harmonized index of consumer prices, compiled by Eurostat using common rules across all member states. Each country produces a national index the same way, and the euro area figure is a weighted average. The European Central Bank’s 2 percent target refers to the annual change in this index.
Why did euro area inflation rise so sharply in 2026?
The war that began on 28 February 2026 pushed oil and gas prices sharply higher, and the euro area imports most of its energy. Fuel prices repriced within days, household energy and transport costs followed, and by May the annual rate had climbed from 1.64 to 3.14 percent. There was no domestic demand surge behind the move, which is why it began easing by June.
Why does an energy shock raise inflation only temporarily?
Annual inflation compares prices with the same month a year earlier. An energy shock lifts the price level in a burst; once the level stabilizes, each passing month brings the comparison base closer to the new level and the annual rate falls back. The shock becomes permanent inflation only if it feeds into wages and expectations, which is what central banks work to prevent.
Is inflation the same in every euro area country?
No. The euro area figure is an average across economies whose national rates can differ by more than two percentage points at the same moment, depending on energy mix, regulation, and domestic conditions. The average describes the currency union as a whole, not any individual country’s experience.
Did the ECB raise interest rates in response to the 2026 oil shock?
The ECB held its deposit rate at 2.25 percent through the spike rather than tightening into it. A central bank cannot lower the world price of oil; its concern is preventing a one-off price jump from becoming embedded in wages and expectations. The easing of the annual rate by June 2026, with policy unchanged, is consistent with that approach.
Thanks for reading! One dated shock, eighteen monthly readings, and the whole mechanism of imported inflation is visible without a single equation. Happy learning with MASEconomics