Every inflation headline rests on a shopping list nobody ever took to a store. The cpi basket is the collection of goods and services whose prices a statistical agency tracks to compute the consumer price index: hundreds of categories, from bread and rent to haircuts and streaming subscriptions, each weighted by how much of the average household’s budget it absorbs. When the news says prices rose 3 percent, that is not a fact of nature. It is the change in the cost of this particular list, weighted this particular way, and every choice behind the list, what enters, what stays out, and how much each item counts, was made by people answering a question with no single right answer: whose spending should the official measure of the cost of living describe?
The answer statisticians settled on is everyone’s and therefore no one’s. The basket portrays an average household assembled from expenditure surveys, and since no actual family spends like the average, no actual family experiences the official inflation rate. That is not a scandal; it is the design. But it explains the most common complaint about inflation statistics, the gap between the number and the checkout counter, and understanding how the list is built is the fastest way to read the index for what it is.
How an Item Earns Its Place
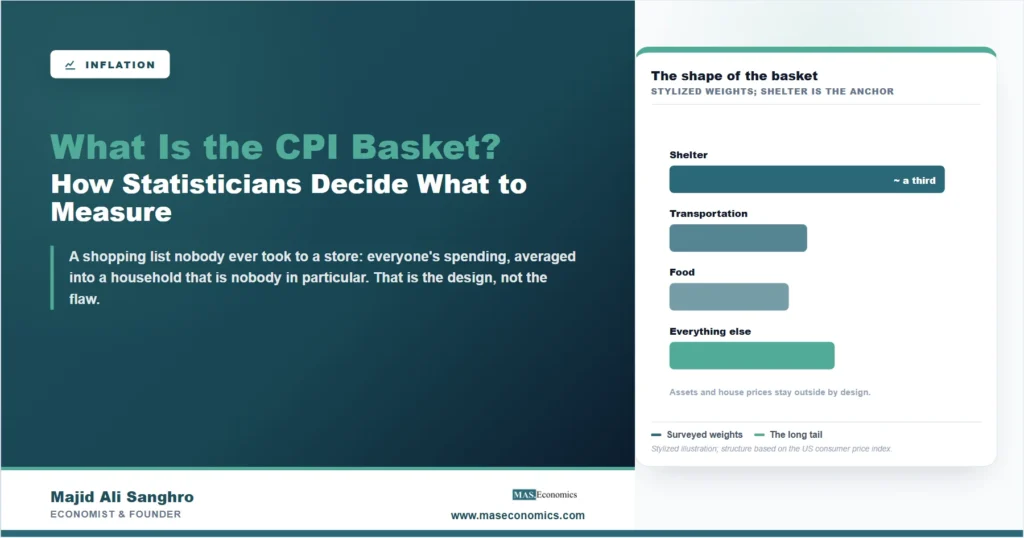
The basket begins with surveys, not committees. Statistical agencies run large ongoing surveys asking households to record what they actually buy, diaries of groceries and interviews about big purchases, and the results determine both membership and weight. Spend more of the national household budget on something, and it occupies more of the basket. In the United States, shelter alone carries roughly a third of the index’s weight, which is why housing costs dominate the behavior of American inflation whatever gasoline is doing. The mechanics of turning tens of thousands of collected prices into one monthly number are the subject of our closer look at the consumer price index; the basket is the part decided before any price is collected.
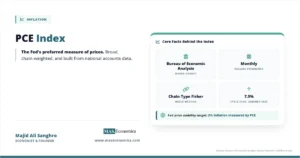
Weights are updated on a schedule, and the updates matter. A basket frozen in 2019 would still be pricing a world of commuting and cinema tickets; the pandemic’s shift to home offices and delivery had to be surveyed before it could be measured. Between updates, the index quietly assumes households keep buying the old proportions even as prices change, which overstates the pain slightly, since real households substitute toward whatever got relatively cheaper. That substitution gap is one of the standing technical arguments in price measurement, and it is why the Federal Reserve prefers an index with self-updating weights, the PCE index, whose basket re-forms from spending data continuously.
What Never Enters the Basket, and Why
The exclusions define the index as much as the contents. The basket contains only consumption, so the largest purchases most households ever make are absent by design: shares, bonds, and houses as assets. A house enters the American index only through an estimate of what owners would pay to rent their own homes, not through its purchase price, which means a housing boom can rage while measured inflation stays calm. That boundary between consumption and assets is deliberate, defensible, and consequential, and its consequences for how booms hide from the statistics are the subject of our article on asset price inflation.
Also outside: income taxes, which are not a purchase; interest costs in most modern indexes; and anything free at the point of use, however valuable. The index prices what households buy, not what living costs in a broader sense. These lines explain recurring public confusion, such as inflation feeling mild while mortgage payments and house prices surge, and they are why different questions need different measures: production-wide inflation belongs to the GDP deflator, and the full cast of indexes, with which institution watches which, is mapped in inflation reports explained.
One further set of adjustments happens inside the items themselves. When a phone doubles in capability at the same price, statisticians record a price fall for computing power even though the sticker never moved, a practice called quality adjustment. It is principled, the alternative is treating a vastly better product as the same product, and it is a durable source of the gap between measured and felt inflation, since nobody experiences a hedonic improvement as money returned to their pocket.
Why Your Inflation Differs From the Official One
Assemble the design choices and the everyday complaint explains itself. A renting student, a car-dependent rural family, and a retired couple with heavy medical spending own three different baskets, and none matches the survey average. Households also notice frequent purchases, groceries and fuel, far more than the slow-moving categories that carry much of the weight, so felt inflation tracks the volatile items the official core measures deliberately look through, a design tension covered in our piece on core CPI. Both readings are correct answers to different questions: the index measures the average household’s basket; the household experiences its own.
The stakes of the design are not academic. The basket’s behavior moves wage negotiations, pension adjustments, benefit levels, and tax thresholds for millions of people, which is why methodological choices that sound like trivia, whose spending is surveyed, how owners’ housing is treated, when weights update, periodically become political arguments. A measure asked to be one number for everyone will always be slightly wrong for anyone, and the honest response is not to distrust the index but to know which question it answers.
MASEconomics Explains
3 economic concepts behind the CPI basket
These concepts are explored in depth across our educational articles library.
Explore the MASEconomics BlogConclusion
The cpi basket is the answer to a question that had to be answered somehow: which prices, weighted how, should stand for the cost of living of an entire country? The design that emerged, survey-based weights, consumption only, scheduled updates, quality adjustment, produces a serious and consistent measure of the average household’s costs, and simultaneously guarantees that no individual household will recognize its own experience in the number exactly. Both properties come from the same choices.
Reading the index well means holding its boundaries in view: assets and their booms live outside it, volatile items dominate perception while slow categories dominate the weights, and the portrait is of an average that is nobody in particular. The basket cannot be everyone’s; what it can be, and is, is the same list measured the same way over time, which is what makes the change in its cost, the inflation rate, meaningful at all.
Frequently Asked Questions
What is in the CPI basket?
Hundreds of categories of consumer goods and services: housing costs, food, transportation, medical care, recreation, education, apparel, and personal services, each weighted by its share of average household spending as measured in expenditure surveys. In the United States, shelter alone carries roughly a third of the total weight.
Who decides what goes into the CPI basket?
The national statistical agency, based on household expenditure surveys rather than committee judgment. In the United States the Bureau of Labor Statistics uses consumer expenditure surveys to set both the basket’s contents and each item’s weight, updating them on a regular schedule so the list tracks how spending patterns actually change.
Are house prices included in the CPI?
Not directly. A house is treated as an asset, and the index measures consumption, so American statistics capture housing through owners’ equivalent rent, an estimate of what owner-occupied homes would rent for. House purchase prices themselves sit outside the basket, which is why housing booms can coincide with calm measured inflation.
Why does my personal inflation feel higher than the CPI?
Because the index prices an average basket that matches no single household, and because people notice frequent purchases like groceries and fuel more than the slow-moving categories carrying much of the weight. A household whose spending leans toward fast-rising items genuinely faces higher inflation than the average the index reports.
How often is the CPI basket updated?
Prices are collected monthly, but the basket’s contents and weights are revised on a slower cycle based on new expenditure survey results; the United States now updates weights annually, and other countries follow schedules of one to several years. Between updates the basket is held fixed so that price change, not spending change, drives the index.
Thanks for reading! The next time the official rate and the grocery receipt disagree, the interesting question is which basket each one is pricing. Happy learning with MASEconomics