The Bank of Japan explained in simple terms is the world’s longest-running experiment in unconventional monetary policy. For more than two decades, the institution founded in 1882 under the Meiji-era currency reforms operated at the zero lower bound, accumulated a balance sheet worth roughly 125 percent of GDP, and ended up owning a majority of the Japanese government bond market. In March 2024, Governor Kazuo Ueda formally ended the negative interest rate regime and abolished yield curve control, closing an experiment that began in 2013 under Haruhiko Kuroda, and that had no precedent in the history of large advanced economies. By April 2026, the short-term policy rate sat at 0.75 percent, the highest level since 1995, while the balance sheet remained the largest of any G7 central bank measured against the size of the domestic economy.
This profile sets out what the Bank of Japan does, how it makes decisions, what tools it uses, and how its track record was shaped by the country’s post-1990 lost decades. It places the institution alongside the Federal Reserve, the European Central Bank, and the Bank of England, which, together with the BoJ, form the four central banks whose decisions move global asset prices.
The Central Bank That Owns Its Bond Market
The Bank of Japan is the central bank of Japan, established by the Bank of Japan Act of 1882 and reorganised under the current Bank of Japan Act of 1997. It is headquartered in the Nihonbashi district of Tokyo. Its statutory mandate, as set out in Article 2 of the 1997 Act, is to achieve price stability and to maintain an orderly financial system. A 2 percent year-on-year increase in the consumer price index has served as the operational definition of price stability since January 2013, when the joint statement between the government and the central bank under the Abe administration codified the target.
What makes the institution unusual is the scale of its presence in domestic financial markets. As of late 2025, the Bank of Japan’s balance sheet was approximately 698 trillion yen, equivalent to about 125 percent of nominal GDP. By comparison, the Federal Reserve’s balance sheet at its 2022 peak reached roughly 36 percent of US GDP, and the European Central Bank’s roughly 70 percent of euro area GDP. The BoJ owns more than half of the outstanding stock of Japanese government bonds, a share that no other central bank in the G7 has ever approached. Its holdings of equity exchange-traded funds, accumulated under the Quantitative and Qualitative Easing programme, total roughly 37 trillion yen at book value and carry a market value of around 70 to 83 trillion yen, making the BoJ one of the largest single equity holders in Japan.
The Bank of Japan also operates as banker to the government, sole issuer of yen banknotes, and overseer of the payment and settlement system that processes interbank yen transfers. It conducts foreign exchange intervention on instructions from the Ministry of Finance, which retains formal authority over currency policy. This division of labour, in which monetary policy is set independently by the BoJ but currency intervention is directed by the Ministry of Finance, distinguishes Japan from jurisdictions where the central bank holds both powers.
Key facts at a glance. Founded 1882. Current Governor: Kazuo Ueda (term April 2023 to March 2028). Policy Board: 9 members. Inflation target: 2 percent CPI year-on-year. Short-term policy rate (April 2026): 0.75 percent. Balance sheet (Nov 2025): approximately 698 trillion yen, around 125 percent of GDP.
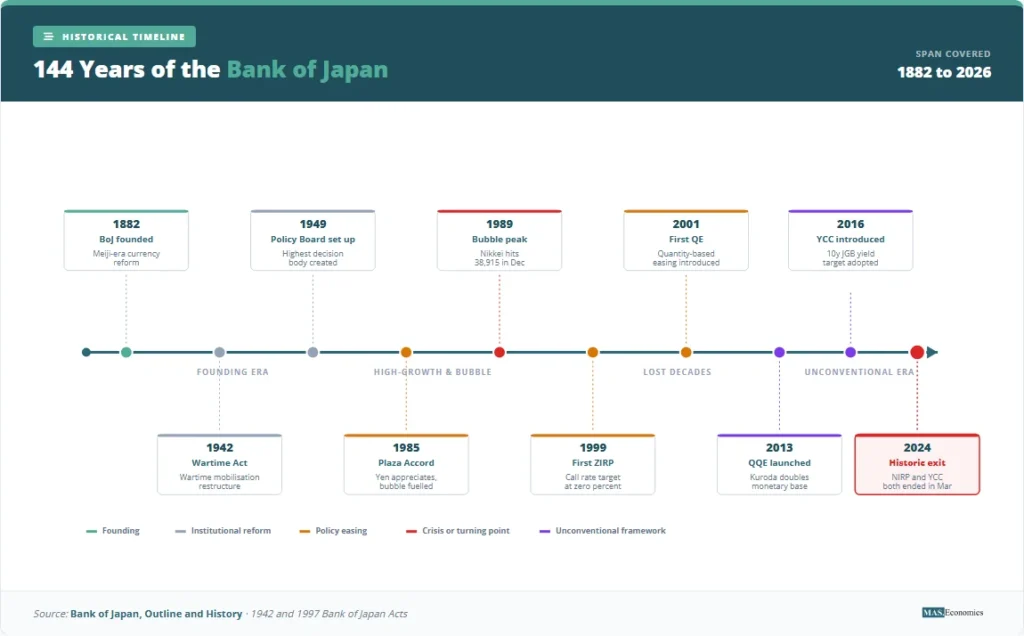
A 144-Year Lineage Forged by Crisis
The institution was created in October 1882 to centralise note issuance and stabilise the chaotic post-Meiji Restoration banking system, which had seen 153 national banks each issue their own paper currency. Its founding statute was modelled on the Belgian and German central banking laws of the period rather than on the Bank of England. Matsukata Masayoshi, the finance minister who pushed the law through the Diet, designed the bank around a hard-money philosophy aimed at ending the inflation that followed the Satsuma Rebellion of 1877. The first yen banknote was issued in 1885.
The bank operated as a privately chartered institution with close government oversight through the Meiji, Taisho, and early Showa periods. Major restructurings came in 1942, under the Bank of Japan Act passed during the wartime mobilisation, and again in 1997, when the current Act gave the institution the independence framework that broadly mirrors the post-1989 New Zealand model. The 1997 reform separated monetary policy from direct Ministry of Finance control and placed it in the hands of the Policy Board.
The post-war track record divides into four eras. The high-growth period from 1955 to 1973 saw the BoJ use window guidance, an administrative credit-quota system, to allocate bank lending in line with industrial policy. The post-Bretton Woods era from 1973 to 1989 featured the BoJ accommodating the surge in asset prices that produced the late-1980s bubble, with the discount rate cut to 2.5 percent in February 1987 and held there until May 1989. The post-bubble period from 1990 to 2012 saw repeated and ultimately unsuccessful attempts to escape deflation, including the first zero interest rate policy in 1999, the first quantitative easing experiment from 2001 to 2006, and the second round of QE following the global financial crisis. The current era, beginning with Kuroda’s appointment in April 2013, opened with the Quantitative and Qualitative Easing programme and ended in March 2024 with Ueda’s exit from negative rates and yield curve control.
The depth of the deflation that defined the 1990 to 2012 period is documented in the MASEconomics case study on Japan’s Lost Decades, which explains why the standard monetary transmission mechanism failed to lift the economy out of a liquidity trap despite policy rates pinned at zero.
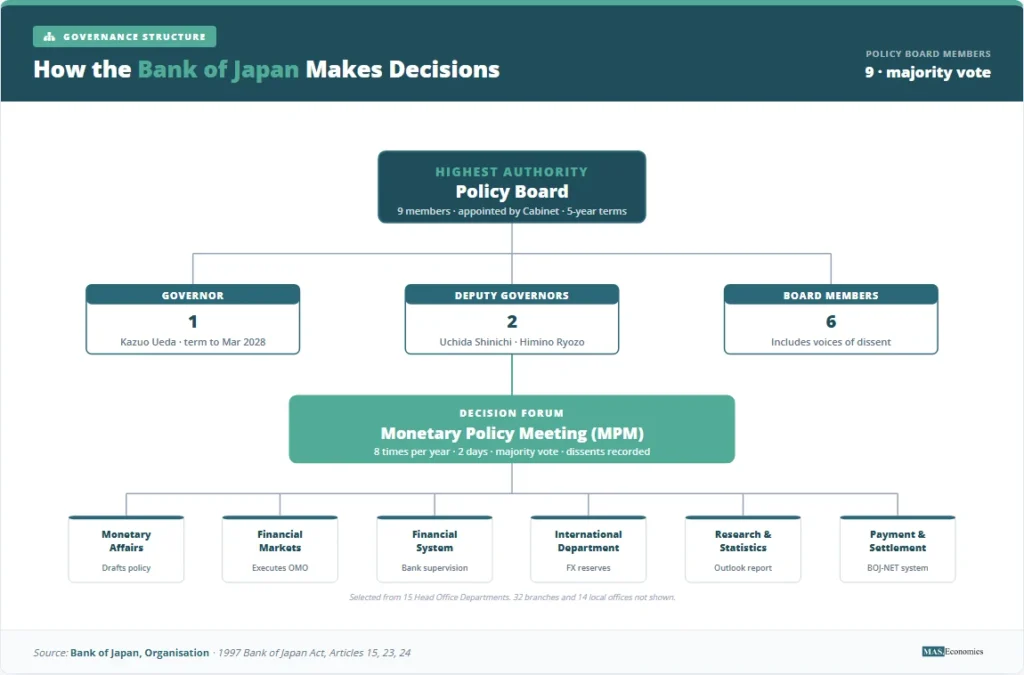
Inside the Nine-Member Policy Board
Monetary policy decisions rest with the Policy Board, a body of nine members. The Governor and two Deputy Governors form the executive leadership; the remaining six members serve as full-time Policy Board members. All nine are appointed by the Cabinet, subject to consent from both houses of the Diet, the House of Representatives and the House of Councillors, under Article 23 of the 1997 Act. Terms are five years, and members may be reappointed.
The Policy Board convenes the Monetary Policy Meeting eight times a year, with each meeting held over two days. Decisions are taken by majority vote of the nine members; the Governor’s vote carries no special weight beyond breaking a tie. The Outlook for Economic Activity and Prices, the BoJ’s quarterly forecasting document analogous to the Federal Reserve’s Summary of Economic Projections, is published at the January, April, July, and October meetings. Decisions are released immediately at the close of the second-day session, followed by a press conference by the Governor approximately three hours later.
Dissents are recorded publicly. The April 2026 decision to hold the policy rate at 0.75 percent passed by a 6 to 3 vote, with members Hajime Takata, Naoki Tamura, and Junko Nakagawa each calling for a hike to 1.0 percent. Public dissents at this level are far more common at the BoJ than at the European Central Bank, where unanimity has been the norm, and broadly comparable to the dissent patterns observed at the Federal Open Market Committee.
The Bank’s daily operations are run by the Executive Directors, who number up to six and supervise the fifteen head-office departments. The Monetary Affairs Department drafts policy options for the Policy Board, the Financial Markets Department executes open market operations and any foreign exchange intervention ordered by the Ministry of Finance, and the Financial System and Bank Examination Department supervises the financial institutions that hold current accounts at the BoJ. Internal Auditors report directly to the Policy Board, and three external Auditors are appointed by the Cabinet to verify the Bank’s accounts.
Independence under the 1997 Act is broader than under the wartime statute that preceded it but narrower than under, say, the European Central Bank’s Treaty mandate. The Ministry of Finance retains formal authority over foreign exchange intervention and over currency issuance, and the government may request, though not direct, that the Policy Board reconsider a decision. The relationship between political accountability and operational independence at the BoJ is examined in greater depth in Understanding Central Bank Independence and Its Importance.
QQE, Yield Curve Control, and the BoJ Toolkit
The Bank of Japan’s policy toolkit is unusually wide because successive Governors had to invent new instruments as the zero lower bound rendered the standard playbook unworkable. The current set, as of April 2026, retains some of the unconventional instruments introduced under Kuroda alongside a now-active conventional short-rate corridor.
| Tool | Description | Current Setting | Last Changed |
|---|---|---|---|
| Short-term policy rate | Uncollateralised overnight call rate target | 0.75 percent | Jan 2026 |
| Yield Curve Control | 10-year JGB yield target band | Abolished | Mar 2024 |
| JGB purchases | Ongoing flow plus stock holdings of Japanese government bonds | Reduced from 5.7 to 2.9 trillion yen per month | Q1 2026 |
| ETF and J-REIT purchases | Equity exchange-traded fund and real-estate trust purchases | Paused since 2023; gradual sales scheduled | Sep 2025 |
| Forward guidance | Communication about future policy path | State-contingent | Apr 2024 |
| Funds-Supplying Operations | Lending facilities to support bank credit | Active | Ongoing |
| Reserve requirements | Required reserve ratio on deposits | 0.05 to 1.20 percent | Aug 2008 |
 |
|||
The short-term policy rate is the operational instrument under the post-2024 regime. The BoJ steers the uncollateralised overnight call rate toward a target by managing the volume of current account deposits that financial institutions hold at the central bank and by setting the rates paid on those deposits. The shift to a positive policy rate in March 2024 ended Japan’s eight-year experiment with negative interest rates, which had charged commercial banks 0.1 percent on a portion of their excess reserves since February 2016.
Yield Curve Control, introduced in September 2016, was the most distinctive instrument the BoJ ever deployed. Under YCC the Policy Board committed to purchase whatever quantity of 10-year Japanese government bonds was needed to hold that maturity’s yield within a stated band, initially around zero percent plus or minus 0.1 percent, later widened in stages to plus or minus 0.5 percent in December 2022 and to a 1.0 percent reference upper bound in October 2023. The framework was formally abolished on 19 March 2024 alongside the exit from negative rates. JGB purchases continue but at a declining pace, falling from a peak monthly flow of 5.7 trillion yen in August 2024 to 2.9 trillion yen in the first quarter of 2026.
The equity ETF programme, launched in 2010 under a separate authority and dramatically expanded under QQE, left the BoJ holding equity exposure that no other major central bank had ever taken on. ETFs and J-REITs combined currently represent about 5.6 percent of total assets. Net new purchases ended in 2023. The September 2025 framework committed the Policy Board to a slow disposal: ETFs at 330 billion yen per year and J-REITs at 5 billion yen per year, a pace that would take more than a century to complete at current values. The mechanics of asset purchase programmes are explained in the MASEconomics primer on quantitative easing; the corresponding unwind process is covered in quantitative tightening.
Funds-Supplying Operations against pooled collateral and the Loan Support Programme give the BoJ a lending channel parallel to the Federal Reserve’s discount window. Reserve requirements, set in 2008, are now economically inactive given the very large stock of excess reserves on bank balance sheets, but they remain on the statute book as a contingency. The general role of these instruments in the standard central banker’s toolkit is set out in Monetary Policy Tools: How Central Banks Manage Economies.
From 1990 Bubble to the 2024 Exit
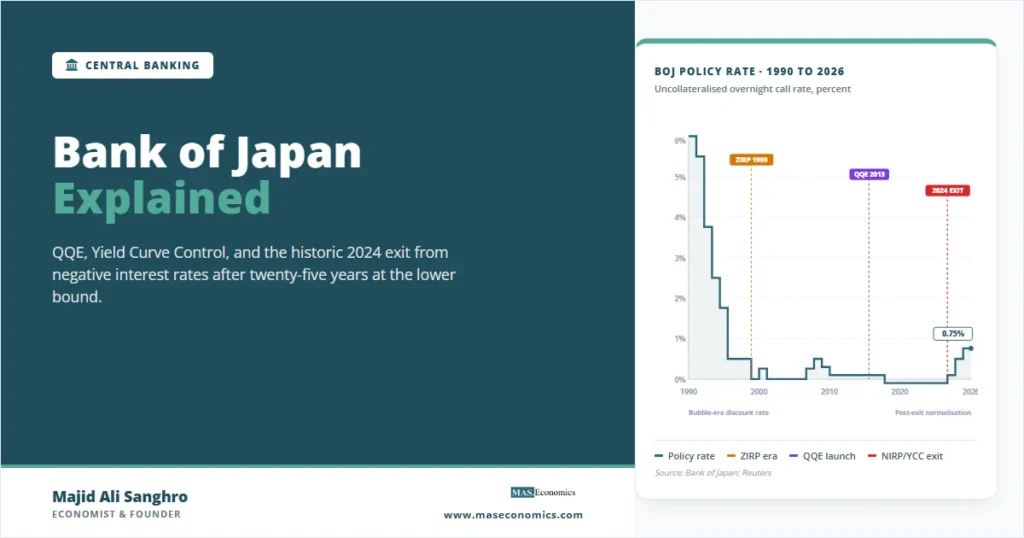
The Bank of Japan’s modern track record is dominated by a single 35-year episode: the slow-motion deflationary trap that followed the bursting of the late-1980s asset price bubble. The policy rate path from 1990 to 2026 reads like a stress test of the standard monetary policy textbook, and the visual below traces the operational rate the BoJ targeted at each stage of that path.
The post-bubble cuts began in July 1991, when the official discount rate stood at 6.0 percent. By 1995, the discount rate had reached 0.5 percent, the lowest in any G7 economy at that time. The first zero-interest rate policy, which targeted the overnight call rate at “essentially zero,” was introduced in February 1999. The Bank tightened briefly in August 2000, raising the call rate to 0.25 percent, only to reverse and adopt the first version of quantitative easing in March 2001 as the dotcom recession hit. That first QE programme, which managed the quantity of current account balances rather than a price target, was wound down in March 2006.
The global financial crisis brought a return to near-zero policy rates in 2008 and 2009 and the introduction of the Comprehensive Monetary Easing programme in October 2010, which expanded asset purchases to include corporate bonds, ETFs, and J-REITs for the first time. The watershed came with the appointment of Haruhiko Kuroda as Governor in April 2013. Within a week, the Policy Board announced Quantitative and Qualitative Easing, committing to double the monetary base in two years, double JGB holdings, and double the average duration of those holdings. QQE was the most aggressive monetary stimulus ever attempted by an advanced-economy central bank.
QQE was extended in October 2014, supplemented with negative interest rates in February 2016, and reorganised in September 2016 around Yield Curve Control. Inflation refused to settle durably at the 2 percent target despite all of this until the 2021 to 2023 global inflation surge finally generated sustained domestic price pressures. The combination of imported energy inflation, the post-pandemic recovery, and the Shunto wage-bargaining round of spring 2024, which produced the largest pay rises in three decades, gave the Policy Board the analytical case for normalisation.
The 19 March 2024 decision was the inflection point. The Bank ended the negative interest rate policy, abolished yield curve control, and ended ETF and J-REIT purchases. The uncollateralised overnight call rate target was set at 0.0 to 0.1 percent and was raised in three subsequent steps to reach 0.75 percent by January 2026. The pace of normalisation has been deliberately gradual, with Policy Board members emphasising the asymmetric risks of moving too quickly after 25 years at the zero lower bound. The implications of this divergence between the BoJ’s tightening cycle and the easing cycles underway at the Federal Reserve, the European Central Bank, and the Bank of England are analysed in Central Bank Divergence in 2026.
The 2024 exit in numerical terms. Between March 2024 and January 2026, the BoJ raised its policy rate from minus 0.1 percent to 0.75 percent, an 85 basis point cumulative move. Over the same period the 10-year JGB yield rose from approximately 0.7 percent to 2.47 percent, the highest since the late 1990s. The yen weakened from 149 against the US dollar at the time of the March 2024 decision to roughly 159 by April 2026, reflecting persistent rate differentials with the United States.
Demographics, Debt, and the Limits of the Exit
The structural challenges facing the Bank of Japan are not, primarily, monetary. Japan’s working-age population peaked in 1995 and has fallen by roughly 14 percent since. The total population peaked in 2008, and the dependency ratio is among the highest in the OECD. These demographic dynamics depress the equilibrium real interest rate, sometimes called r-star, and constrain the Policy Board’s ability to lift nominal rates without choking off domestic demand. Estimates from BoJ research place Japan’s natural rate at or near zero in real terms, far below the levels assumed in canonical Taylor Rule estimates for the United States, a topic developed in the MASEconomics primer on the Taylor Rule.
A second constraint is the size of the public debt. Japanese gross government debt exceeds 250 percent of GDP, the highest in the G7 by a wide margin. About half of the outstanding JGB stock sits on the Bank of Japan’s balance sheet, and most of the remainder is held by domestic financial institutions and the Government Pension Investment Fund. Foreign ownership of JGBs is below 15 percent. This domestic financing pattern protects Japan from the sudden-stop dynamics that emerging markets face but creates a tight coupling between fiscal and monetary policy. Higher policy rates raise the government’s interest bill mechanically, and any large mark-to-market loss on the BoJ’s JGB portfolio would flow through to the central bank’s own capital position.
A third challenge is the unwind of the equity ETF book. The BoJ acquired its ETF holdings at an average book value of roughly 21,500 on the Tokyo Stock Price Index. With TOPIX trading well above that level in early 2026, the unrealised gain is large, but the political and market-impact considerations of selling have led the Policy Board to opt for a multi-decade disposal pace. Critics argue that this prolongs the distortion to corporate governance that comes from having a central bank as the largest non-controlling shareholder in a substantial fraction of Tokyo-listed companies.
A fourth set of concerns sits at the intersection of currency policy and monetary policy. The Ministry of Finance retains authority over foreign exchange intervention but uses the BoJ as agent. The persistent weakness of the yen since 2022 has been a politically sensitive variable for the Policy Board, and the April 2026 decision to hold rates was widely interpreted by market participants as partly a defence against further yen depreciation rather than only a response to inflation forecasts. The institutional separation of monetary and currency authority means the BoJ’s reaction function is more constrained than the simple inflation-targeting framework would suggest, a tension explored in Understanding Central Banking and Monetary Policy.
Reform debates inside Japan have centred on three questions. First, whether the inflation target should be rephrased as a range, given the difficulty of hitting any point target precisely in a small-open economy exposed to commodity shocks. Second, whether the 1997 Act should be amended to formalise the BoJ’s macroprudential role alongside its monetary mandate, given the role that financial system imbalances played in the 1980s bubble. Third, whether the joint statement with the government, which has provided the political framework for the 2 percent target since 2013, should be updated to reflect the post-exit operating environment. None of these debates has produced a legislative initiative, and the Ueda Governorship is expected to leave the institutional framework intact through the end of his term in March 2028.
MASEconomics Explains
Four economic concepts behind the Bank of Japan story
These concepts are explored in depth across our educational articles library.
Explore the MASEconomics BlogConclusion
The Bank of Japan explained is the story of an institution that was forced to invent the modern unconventional monetary policy toolkit and then forced, two decades later, to dismantle it. The 2024 exit from negative interest rates and yield curve control closed an experiment that produced more policy innovation than any other central bank attempted in the modern era. What remains is a balance sheet of approximately 125 percent of GDP, a policy rate of 0.75 percent that is still the lowest in the G7, an equity ETF book that will take generations to wind down, and a Policy Board working through the long tail of normalisation against a backdrop of structurally weak demographics and the highest public debt ratio in the advanced world. The track record will inform the next generation of central bank responses to liquidity traps, with the BoJ’s experience increasingly cited as the relevant case study by the IMF, the Bank for International Settlements, and the academic literature on the lower bound.
Frequently Asked Questions
What does the Bank of Japan do?
The Bank of Japan is the central bank of Japan, established in 1882. Its statutory mandate under the 1997 Bank of Japan Act is to achieve price stability and maintain an orderly financial system. It sets monetary policy through the nine-member Policy Board, issues yen banknotes, and operates the payment and settlement system for interbank yen transfers. Foreign exchange intervention is conducted by the BoJ on instructions from the Ministry of Finance.
Who is the current Governor of the Bank of Japan?
Kazuo Ueda has served as the 32nd Governor of the Bank of Japan since April 2023. His five-year term runs to March 2028. Ueda is a professor emeritus of economics at the University of Tokyo and received his PhD from MIT in 1980 under Stanley Fischer. He previously served as a member of the BoJ Policy Board from 1998 to 2005.
What is the Bank of Japan’s inflation target?
The Bank of Japan targets 2 percent year-on-year growth in the consumer price index. The target was adopted in January 2013 through a joint statement with the Japanese government and replaced the earlier “understanding” of price stability used since 2006. The target is symmetric and is interpreted as applying over the medium term rather than at any single observation.
Why did the Bank of Japan use yield curve control?
Yield curve control was introduced in September 2016 because conventional quantitative easing was running into operational limits. The Bank was approaching ownership of a majority of the JGB market, and the flattening yield curve was squeezing bank profitability. Targeting the 10-year yield directly, rather than the quantity of bond purchases, allowed the BoJ to maintain monetary stimulus while reducing the pace of purchases and steepening the curve. The framework was abolished in March 2024.
Is the Bank of Japan independent from the government?
The 1997 Bank of Japan Act gives the institution operational independence for monetary policy. The Policy Board sets the policy rate by majority vote and the government has no formal power to direct it. However, foreign exchange intervention authority rests with the Ministry of Finance, the government may request that the Policy Board reconsider a decision, and the joint inflation target statement of 2013 created a framework of coordination on price stability. Independence is therefore narrower than the European Central Bank’s Treaty-based regime but broader than under the wartime statute that preceded 1997.
Thanks for reading! If you found this helpful, share it with friends and spread the knowledge. Happy learning with MASEconomics