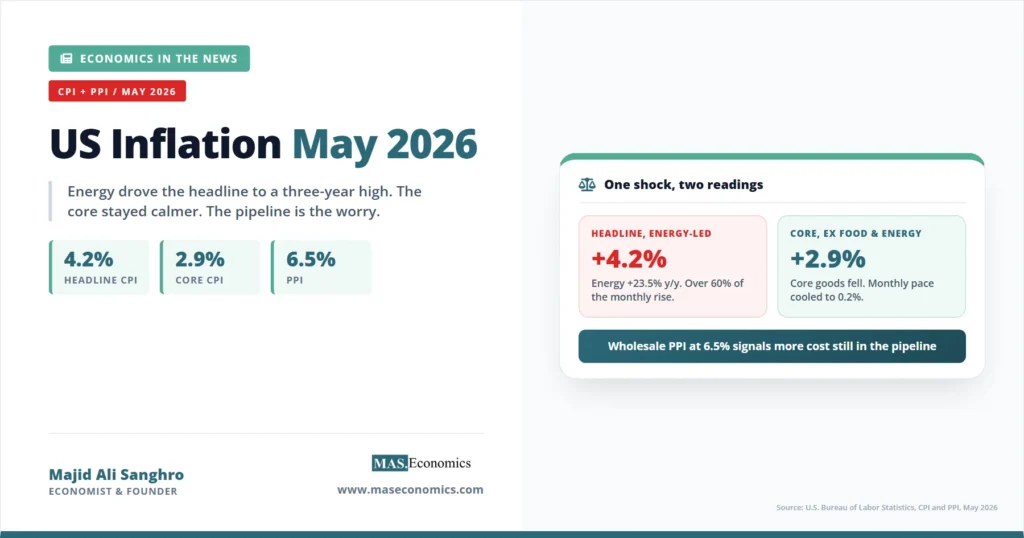
The Bureau of Labor Statistics released two inflation reports on consecutive days in the second week of June, and together they describe an economy where price pressure is building faster at the factory gate than at the checkout counter. US inflation in May 2026 ran at 4.2 percent on the headline Consumer Price Index, the fastest annual pace since April 2023, while the Producer Price Index jumped to 6.5 percent, the hottest wholesale reading since November 2022. The gap between those two numbers, and the energy shock sitting underneath both, is the story that matters going into the Federal Reserve’s June 17 decision.
Headline numbers can mislead when one volatile category does most of the work. In May, energy did almost all of it. Reading the two reports side by side, rather than reacting to either headline in isolation, is the only way to see what is actually happening to the price level and what it means for a central bank that has just changed leadership.
What the May CPI Actually Showed
The all items index rose 0.5 percent on the month and 4.2 percent over the year, both in line with what economists had forecast. The annual figure marked the third consecutive monthly acceleration, climbing from 3.8 percent in April and 3.3 percent in March. On the surface, that looks like an inflation problem that is broadening. Underneath, it is narrower than it appears.
Energy accounted for more than 60 percent of the monthly increase in the all-items index. The energy index rose 3.9 percent in May alone, and over twelve months energy was up 23.5 percent, with gasoline prices up roughly 40 percent year over year. This is the direct fingerprint of the 2026 Iran oil shock, which pushed crude and refined-product prices sharply higher and fed straight into the most visible line on any household budget.
Strip energy and food out, and the picture changes. Core CPI rose just 0.2 percent on the month and 2.9 percent over the year, slightly below the 0.3 percent monthly figure markets expected and a clear step down from April’s 0.4 percent monthly pace. Within core, the pressure was concentrated in services rather than goods: shelter rose 3.4 percent annually, transportation services 4.1 percent, and medical care services 3.6 percent, while core commodities prices actually fell 0.1 percent on the month. That last detail matters, because it indicates that tariff-related goods inflation, a major worry earlier in the year, stayed muted in May. The reasons the Fed strips out food and energy are exactly why this divergence is worth taking seriously, a point developed in core CPI explained.

The PPI Print Was the More Worrying One
The Producer Price Index, released the next morning, told a less comfortable story. Final demand prices rose 1.1 percent in May, well above the 0.7 percent consensus, putting the twelve-month wholesale rate at 6.5 percent. Producer prices measure what domestic producers receive before goods and services reach the consumer, so the index works as an early read on cost pressure still moving through the supply chain. When the Bureau of Labor Statistics publishes the Producer Price Index news release, the detail underneath the headline is usually where the signal sits.
The detail in May was striking. Final demand goods prices rose 2.8 percent on the month, the largest single-month advance since the series began in December 2009, and roughly 80 percent of that came from a 10.7 percent jump in final demand energy. Wholesale gasoline alone rose 23.4 percent. The same energy shock visible in the consumer data appears here at an earlier stage, which is the part that should hold a central banker’s attention: cost increases that have not yet fully reached the consumer are still in the pipeline.
The relationship between the two indices is not mechanical, and producer price increases do not pass through one for one. Firms can absorb higher input costs in their margins rather than raising shelf prices, especially when demand is soft. But a 6.5 percent wholesale reading sitting above a 4.2 percent consumer reading describes an economy where the pressure is loaded toward future months, not behind us. The way currency and input-cost shocks eventually reach shelf prices is the subject of inflation pass-through, and the same logic applies to an energy-driven cost shock.
| Measure | Monthly | Annual | Main driver |
|---|---|---|---|
| Headline CPI | +0.5% | +4.2% | Energy (over 60% of monthly rise) |
| Core CPI | +0.2% | +2.9% | Shelter and core services |
| Headline PPI (final demand) | +1.1% | +6.5% | Final demand energy (10.7% jump) |
| Core PPI (ex food, energy) | +0.4% | +4.9% | Services, portfolio management fees |
| Read across | — | — | Energy-led headline, calmer core, pipeline pressure ahead |
|
Source: U.S. Bureau of Labor Statistics, CPI and PPI releases, May 2026.
|
|||
Why the Energy Distinction Changes the Policy Question
Central banks treat energy-driven inflation differently from broad-based inflation for a structural reason. An oil shock is a relative price change and, in the standard framing, a supply shock. It raises the price level and lowers real incomes at the same time, which pulls the two halves of the Fed’s mandate in opposite directions. Tightening policy to fight the inflation would deepen the hit to growth and employment; easing to support growth would let the inflation run. This is the uncomfortable trade-off that defines the current moment, and it is the same tension mapped out in the Phillips curve.
The reason the soft core reading carries weight is that it speaks to whether the energy shock is leaking into everything else. If wages and core services prices stay anchored while energy spikes, a central bank can plausibly argue the shock is a one-off level effect that will fade from the annual comparison once oil prices stabilize. The May core figure of 2.9 percent, decelerating on a monthly basis, supports that reading. The danger is the PPI, which suggests the cost wave has not finished moving through. If those producer costs reach consumers over the summer and feed into wage demands, the one-off story becomes a persistence story, and the policy calculus hardens.
Caveat. A single month does not establish a trend. Oxford Economics and others have noted that gasoline prices eased in early June, which means May may mark the headline peak. The pipeline pressure in the PPI is the reason that call is not yet certain.
What This Sets Up for June 17
The two reports landed one week before the Federal Open Market Committee meets on June 16 and 17, the first meeting chaired by Kevin Warsh after he succeeded Jerome Powell. Markets went into the data expecting no change to the 3.50 to 3.75 percent target range, and the prints did little to shift that base case. What the reports did do is sharpen the debate about direction. Hawkish readings of a 4.2 percent headline and a 6.5 percent PPI give weight to the argument that the next move could be a hike rather than a cut, a reversal of where expectations sat at the start of the year. The softer core gives the doves something to point to.
The institutional context matters as much as the numbers. The Fed entered this period with an unusually divided committee, and the leadership transition adds another variable. Warsh inherits both the energy shock and the divisions, a situation set out in Kevin Warsh’s move to the Fed chair. How the committee reads the CPI and PPI split, as a fading supply shock or as the leading edge of persistence, will shape not just the June statement but the tone of the new chairmanship. The structure that governs how that decision is actually made is laid out in the Federal Reserve explained profile, and the broader economy it is acting on is described in the US economy profile.
Reading the Two Reports as One Signal
US inflation in May 2026 is best understood not as a single number but as a divergence: a headline pushed up by an energy shock, a core that is holding closer to target, and a wholesale index warning that more cost pressure is still in transit. The 4.2 percent CPI headline will dominate news coverage, but the 2.9 percent core and the 6.5 percent PPI are the figures that tell the Fed whether this is a level shock to ride out or the start of something more persistent.
For now, the evidence cuts both ways. The concentration of the increase in energy, and the muted behavior of core goods prices, argues for patience. The record monthly jump in final demand goods prices argues for vigilance. That balance is exactly why the June 17 meeting will be read less for the rate decision, which markets treat as settled, than for what the committee signals about the path ahead under its new chair.
Thanks for reading! If you found this helpful, share it with friends and spread the knowledge. Happy learning with MASEconomics