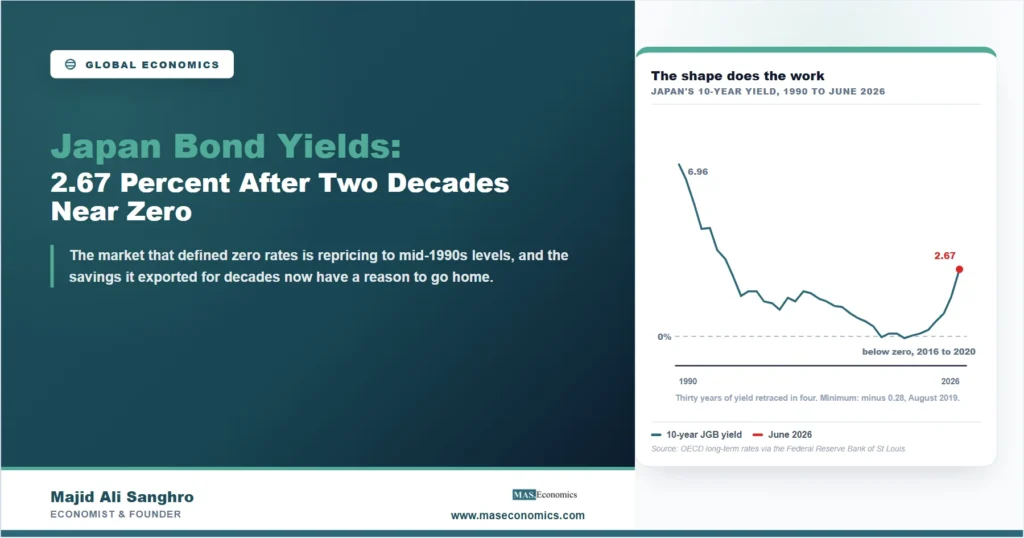
The most consequential chart in global finance this year has no crisis in it. Japan bond yields reached 2.67 percent on the 10-year government bond in June 2026, a level last seen in the mid-1990s. For most countries that would be an unremarkable borrowing cost. For Japan it is the end of an era that defined a generation of economics: this is the bond market that spent the 2010s pinned at zero, that traded at negative yields as recently as 2020, and that served as the world’s reference case for what happens when interest rates die. They are back, and almost nobody outside the bond market is talking about it.
The scale of the move deserves the numbers. Japan’s 10-year averaged 6.96 percent in 1990, ground down to an average of minus 0.07 percent by 2016, and touched minus 0.28 in August 2019. As late as 2021 the annual average was 0.07 percent. Then the stairs turned upward: 0.23 in 2022, 0.56 in 2023, 0.92 in 2024, 1.55 in 2025, and 2.24 to 2.67 across the first half of 2026. A market that took twenty-five years to reach zero has retraced thirty years of yield in four.
The Shape of Thirty-Six Years
The long slide down that slope is one of the most studied episodes in macroeconomics, the world our case study of Japan’s lost decades walks through: the 1990 asset bust, deflation settling in, and a bond market that came to price permanent stagnation. The policy apparatus built to fight it grew ever more elaborate, from zero rates in 1999 to quantitative easing in 2001, massive expansion in 2013, negative rates in January 2016, and finally yield curve control that autumn, under which the central bank simply pinned the 10-year yield near zero by decree. The full machinery, and its dismantling in 2024, is the subject of our profile of the Bank of Japan.
What the right-hand edge of the chart records is that machinery being retired while inflation, absent for a generation, finally returned and stayed. The yield’s climb from 2022 onward is Japan’s bond market doing, for the first time in decades, what bond markets normally do: pricing growth, inflation, and the government’s enormous debt without an administered ceiling. A 2.67 percent yield beside the tightest labor market of the major economies, unemployment of 2.5 percent, reads less like distress than like a country rejoining the ordinary world of positive interest rates.
Why the Quietest Regime Change Is the Biggest
The move matters far beyond Tokyo for a structural reason: decades of zero at home turned Japan into the world’s great exporter of savings. Japanese institutions, from life insurers to pension funds, went abroad for yield and became, among other things, some of the largest foreign holders of US Treasuries, while cheap yen funding financed investment positions across global markets. Every percentage point of yield at home changes that calculus. Money that left because Japan paid nothing now has a reason to come back, and even a partial repatriation by the world’s largest creditor nation tightens financial conditions everywhere else, showing up as marginally higher long rates in markets that never think about Japan.
That is why this chart pairs with the other great bond repricing of the moment. Our analysis of the American long end found the US 10-year rising on term premium even as the Fed cut. The world’s two largest government bond markets are thus moving upward together, for different reasons, the United States because investors demand more compensation for fiscal risk, Japan because artificial gravity has been switched off. For global borrowers the distinction is academic: the two anchors of world long-term rates are both rising, and everything priced off them, from mortgages to project finance, inherits the drift. The mechanics of why existing bondholders lose when yields rise are set out in our primer on how bonds work; Japan’s savers are experiencing the compensating side, interest income on new savings, for the first time in their working lives.
Two cautions keep the story honest. The yen, at 159 to the dollar in late July, remains weak despite the rising yields, because American short rates still out-pay Japanese ones and the funding flows respond to that gap; the repatriation argument is about direction and margin, not a switch that flips. And Japan’s government, carrying the largest public debt burden of any major economy relative to its output, now faces rising interest costs on it, the same arithmetic pressing every treasury this decade. The countries that spent years studying Japan’s liquidity trap as an exotic disease may next study how a heavily indebted state manages the cure.
MASEconomics Explains
3 economic concepts behind Japan’s repricing
These concepts are explored in depth across our educational articles library.
Explore the MASEconomics BlogConclusion
Japan bond yields at 2.67 percent close the loop on the strangest journey any major bond market has taken: from 6.96 percent in 1990, through a quarter century of decline, below zero for stretches of 2016 to 2020, and back to mid-1990s levels in a four-year climb that began when inflation returned and finished when the central bank stopped holding the yield down. The level is unremarkable; the arrival at it, from where Japan started, is the largest regime change in any major market this decade, and the least discussed.
Its consequences travel through the savings Japan spent decades exporting. Home yields that pay again pull at money invested across the world’s bond markets, adding a quiet tightening force to a moment when American long rates are already climbing for their own fiscal reasons. The era in which Japan functioned as the world’s zero-rate anchor, lending its savings out because home offered nothing, is over, and global borrowing costs will be discovering what that means for years.
Frequently Asked Questions
Why were Japanese bond yields near zero for so long?
Two forces held them there: a market pricing decades of deflation and stagnation after the 1990 asset bust, and, from 2016, a central bank policy of yield curve control that pinned the 10-year yield near zero by unlimited bond purchases. Together they kept Japan’s long-term rates at or below zero for the better part of a decade.
Why are Japan’s bond yields rising now?
Inflation returned to Japan after a generation’s absence, and the Bank of Japan dismantled the framework that suppressed yields, ending yield curve control in 2024. Freed to price growth, inflation, and Japan’s large public debt, the market moved the 10-year yield from near zero in 2021 to 2.67 percent by June 2026.
Does a higher Japanese yield affect other countries?
Yes, through capital flows. Japan is the world’s largest creditor nation, and its institutions hold enormous foreign bond portfolios, including US Treasuries, accumulated when home yields paid nothing. As Japanese yields rise, some of that money gains a reason to return home, which puts modest upward pressure on long-term rates in the markets it leaves.
Is 2.67 percent a high yield for a government bond?
Not internationally: American and British 10-year yields are well above it. It is high only against Japan’s own recent history, where the same bond yielded nothing or less for years. The significance is the change of regime, from administered zero to market pricing, rather than the level itself.
Why is the yen still weak if Japanese yields are rising?
Exchange rates respond to yield differences, not levels alone, and American short-term rates still pay substantially more than Japanese ones. At 159 to the dollar in late July 2026, the yen reflects that remaining gap. A durable yen recovery would require the differential to narrow much further, whether by Japanese rates rising or American rates falling.
Thanks for reading! The most important charts are sometimes the quiet ones, and a line crawling back above zero in Tokyo may move more money than any headline this year. Happy learning with MASEconomics