Countries with more ice cream consumption have more drownings, hospitals are full of sick people, and nations that drink more coffee publish more research papers. Everyone has heard that correlation is not causation, usually delivered as a conversation-ending slogan, and the slogan is where most people’s understanding stops. That is a pity, because the interesting material starts immediately afterwards. The correlation vs causation distinction is not a debating trick; it is the central operating problem of empirical economics, the reason a whole toolkit of research designs exists, and the difference between a statistic that describes the world and one that can guide a decision. Policy acts on causes: a government that raises schooling because education correlates with income is betting that the correlation is causal, and if it is not, the money buys nothing. Knowing exactly how correlations arise without causation, and how economists nonetheless establish causation when it matters, converts the slogan into a working skill.
Four Roads to the Same Correlation
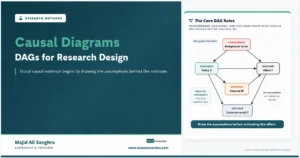
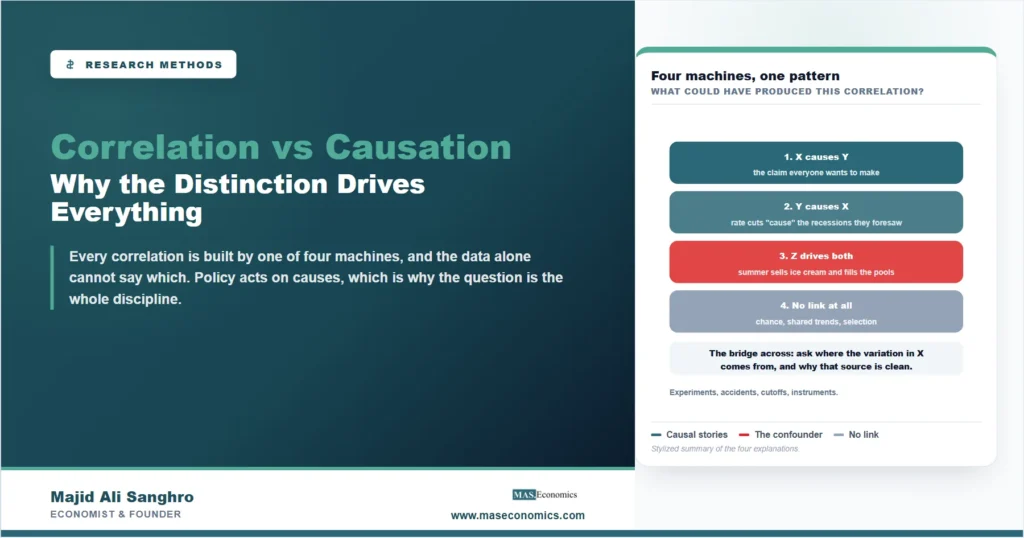
When two variables move together, the pattern has exactly four families of explanation, and the discipline is checking all four before believing the first. The obvious one is genuine causation: X moves Y. The second is causation running backwards: hospitals correlate with sickness because the sick go to hospitals. In economics reverse causation is everywhere and rarely obvious, since anticipation reverses time’s arrow: central banks cut rates because they foresee recessions, so rate cuts correlate with downturns and a naive reading concludes the medicine causes the disease. The third family is the confounder, a third variable moving both: summer heat drives both ice cream sales and swimming, income drives both coffee budgets and research budgets, and neither correlation says anything about what banning ice cream or coffee would do. The fourth family is the residue: chance patterns in small samples, trends that make unrelated series move together, and selection effects, where the process that put observations into the sample creates the pattern, successful firms fill the dataset precisely because they survived whatever is being studied. Mapping which of these stories could generate an observed pattern is what the graphical machinery of causal diagrams exists to do formally.
Why Economics Cannot Shrug and Move On
Some fields can live comfortably with correlation, because prediction is their product: a model that forecasts defaults well is useful whether or not its inputs cause anything. Economics does not have that luxury for most of its questions, because its consumers are decision-makers, and decisions are interventions. A minimum wage, an interest rate change, a schooling subsidy each reach into the machine and move one lever, and only causal knowledge says what happens next; a correlation, however strong, describes the world as it arranged itself, not the world after the lever is pulled. The confusion has real bodies of victims: eras of policy built on correlations that dissolved the moment they were exploited, the most famous being inflation-unemployment relationships that broke when governments treated them as menus. Time-series work adds its own trap with its own vocabulary, since one series predicting another, the concept of Granger causality, establishes predictive order and nothing more; the barometer predicts the storm without causing it.
How Economists Actually Cross the Bridge
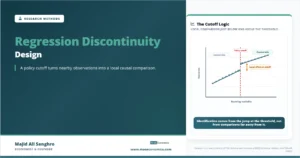
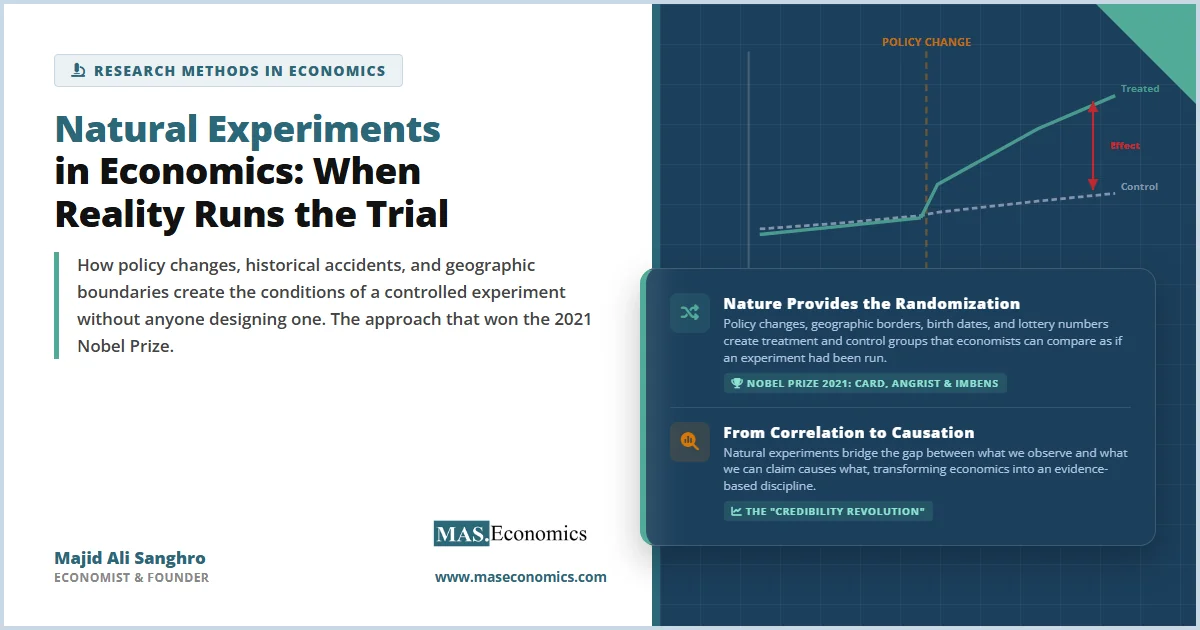
The escape from the slogan is not clever statistics applied to the same data; it is finding or creating variation in X that owes nothing to the confounders and nothing to Y. The cleanest version is the experiment, where randomization manufactures such variation by construction, and its expanding use in economics is surveyed in our article on field experiments. Where experiments are impossible, which is most of macroeconomics and much else, the craft becomes finding accidents that mimic them: policy borders, eligibility cutoffs, lotteries, and sudden rule changes that assign treatment for reasons unrelated to outcomes, the material of natural experiments. Each accident type has its harvesting machine: comparing those just above and below a threshold in regression discontinuity designs, comparing changes across treated and untreated groups in the difference-in-differences and synthetic control methods covered in our guide to policy evaluation methods, and recruiting variables that move X without touching Y directly in instrumental variables designs. The full map, with the assumptions each route needs, is drawn in our practical guide to causal inference. What unites the toolkit is the question it forces every study to answer in one sentence: where does the variation in X come from, and why is that source clean? A paper with a good answer has an identification strategy. A paper without one has a correlation and a hope.
MASEconomics Explains
3 economic concepts behind correlation vs causation
These concepts are explored in depth across our educational articles library.
Explore the MASEconomics BlogConclusion
The correlation vs causation distinction earns its centrality from a simple asymmetry: correlations describe the world as it happens to be arranged, while decisions rearrange the world, and only causal knowledge predicts what the rearrangement will do. Every observed correlation is generated by one of four machines, genuine causation, reverse causation, a confounder, or the pattern-making residue of chance, trends, and selection, and the data alone cannot say which; that is a fact about logic, not a shortage of statistical cleverness, which is why the answer came from research design rather than from better formulas.
The modern toolkit, experiments where possible, harvested accidents where not, is best understood as a single question asked with increasing ingenuity: where does the variation come from? Readers do not need to run these designs to benefit from them. It is enough to ask, of every causal-sounding claim, which of the four machines could have produced its evidence and what the study did to rule out the other three. The slogan ends conversations; the question starts the useful ones.
Frequently Asked Questions
Why is correlation not the same as causation?
Because a correlation between X and Y can be produced four different ways: X causing Y, Y causing X, a third factor driving both, or no link at all, through chance, shared trends, or selection into the sample. The data pattern looks identical in every case, so the pattern alone cannot establish which machine produced it.
Can a correlation ever establish causation?
On its own, no; combined with a credible account of where the variation came from, yes. When the cause was assigned by randomization, a policy accident, a cutoff, or an instrument unrelated to the outcome, the observed relationship carries causal meaning. The evidence is the correlation plus the design, never the correlation alone.
What is a confounding variable?
A factor that influences both variables in a correlation, creating a relationship between them that vanishes once the factor is accounted for. Hot weather raises both ice cream sales and drowning deaths; national income raises both coffee consumption and research output. Confounders are the most common machine behind misleading correlations.
How do economists establish causation without laboratory experiments?
By finding real-world situations that mimic experiments: lotteries, eligibility cutoffs, policy borders, and abrupt rule changes that assign treatment for reasons unrelated to outcomes. Methods such as regression discontinuity, difference-in-differences, and instrumental variables are harvesting machines for these accidents, each with stated assumptions that can be inspected and challenged.
What is a spurious correlation?
A correlation with no causal content in either direction, typically produced by chance in small samples, by two series sharing a trend over time, or by selection effects in how the data were gathered. Trending time series are the classic factory for them, which is why time-series work tests for shared trends before believing any relationship.
Thanks for reading! The slogan ends conversations; asking where the variation comes from starts the useful ones. Happy learning with MASEconomics