The first sign is almost never a statistic. It is a job posting that quietly disappears, an order pushed to next quarter, a manager told to hold headcount flat rather than fill the vacancy that opened in March. Months later a statistical agency confirms what that manager already acted on, and later still a committee of economists announces the month the downturn began, sometimes after it has already ended. The business cycle is the name for this recurring movement of a whole economy through expansion, peak, contraction, and recovery, and the distance between when it is lived and when it is certified is not a defect in the statistics; it is a structural feature of the thing being measured. The cycle is usually drawn as a smooth wave around a rising trend, and that picture is wrong in the three ways that matter most: the phases are grossly unequal in length and violence, they arrive on no schedule that can be counted on, and the turning points that define them are identifiable only in hindsight. Those three corrections are the difference between using the cycle to think and using it to guess.
The Four Phases, and What Each One Actually Is
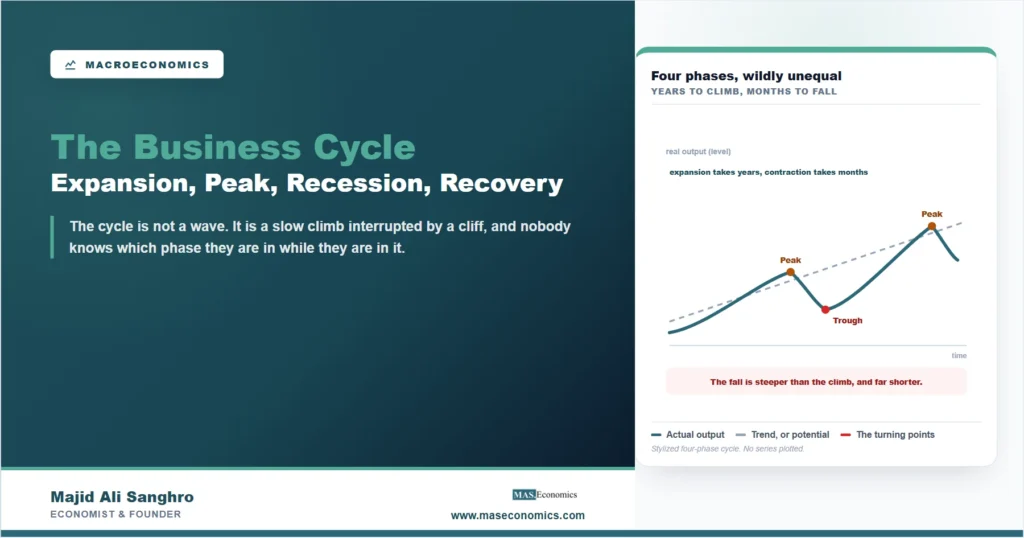
Start with what is being tracked. The cycle is not a movement in one industry or one price but a broad co-movement across output, employment, real income, and sales, which is why a bad year for steel is not a recession and a simultaneous slowdown in hiring, shipments, and household income is. Expansion is the phase in which that broad measure of activity rises: firms add shifts, unfilled vacancies outnumber applicants, credit is easy to get and easy to service, capacity utilization climbs, and, in the later innings, the competition for workers and materials begins to show up as price pressure. The peak is the moment the rise stops. It is a turning point, not a plateau, and it carries a name that misleads almost everyone who meets it: the peak is the highest level of activity, which means it usually arrives when conditions feel best, with unemployment at its lowest and confidence at its highest. Contraction, the phase most people call the recession, is the broad decline that follows, and it is defined by three properties working together, depth, diffusion across sectors, and duration, rather than by any single number crossing a line. The trough is its mirror: the lowest point of activity, the moment things stop getting worse, which arrives while unemployment is still rising and the news is still bad, because employment is a lagging measure of a turn that has already happened. Recovery is the first stretch of the next expansion, the part in which output climbs back to the level it lost; once the old peak is passed, the economy is simply expanding again, which is why recovery and expansion are two names for one direction of travel and why the distinction matters mainly to people arguing about whether things are good yet.
Why the Curve Is Not a Wave
The textbook sine curve gets three things wrong at once, and each correction changes how the phases should be read. The first is symmetry. Expansions in modern economies run for years and climb gently; contractions run for months and fall hard, which is why the honest drawing looks less like a wave than like a slow climb interrupted by a cliff. The asymmetry has a mechanism behind it rather than being a statistical accident: firms shed workers, cut orders, and stop capital projects far faster than they hire, restock, and commit, because the decision to stop costs nothing to reverse later while the decision to expand carries a commitment; credit contracts through a few large refusals and expands only through many small approvals; and fear propagates through supply chains at the speed of a canceled order, while confidence rebuilds at the speed of a signed contract. The reader who has lived through one downturn already knows this in a form the diagram hides: the layoffs arrive in a quarter, the recovered job takes two years. The consequence for unemployment is direct, and its regular relationship to lost output is the subject of Okun’s law.
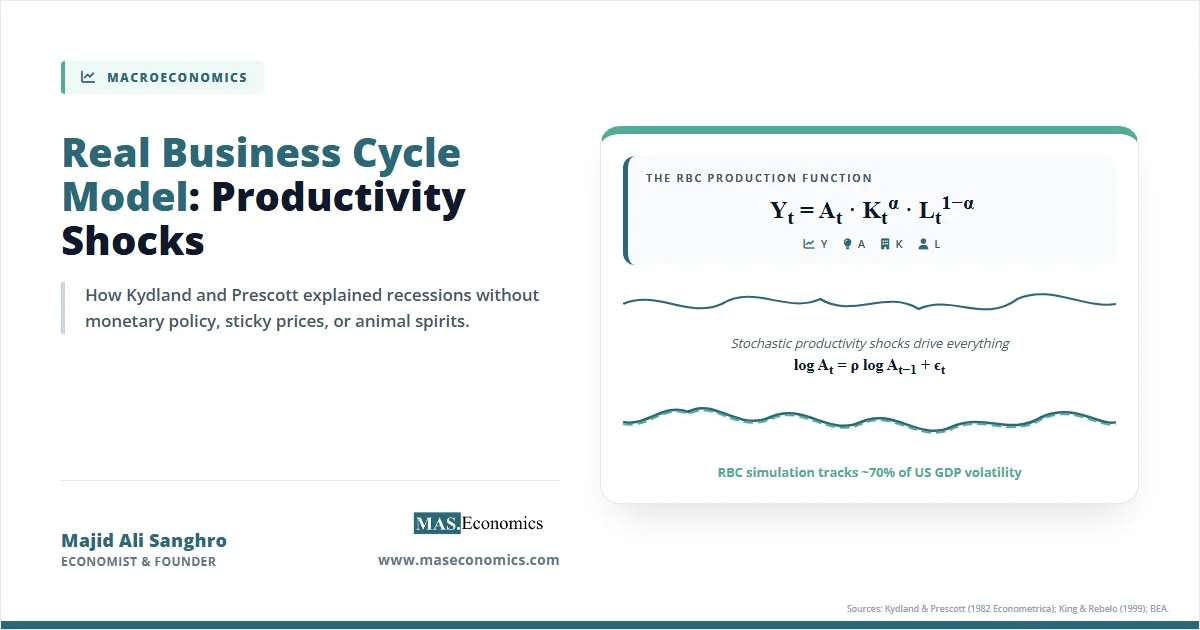
The second error is periodicity. The word cycle implies a period, something that repeats every so many years and can therefore be counted down. Nothing in the record supports that. Post-war expansions have run from about one year to more than a decade, and there is no reliable sense in which an expansion becomes more likely to end simply because it has lasted; expansions do not die of old age, they are ended by something, whether a policy tightening, a financial accident, a commodity shock, or a pandemic. The fixed-length cycles named after nineteenth and twentieth century observers, three to five years here, fifty years there, belong in the history of thought rather than in forecasting practice. What survives is a more modest and more useful idea: shocks hit an economy irregularly, and the economy’s own structure, its inventories, its credit system, its capital commitments, its sticky wages and prices, converts those shocks into fluctuations with a characteristic shape. Which shock and which propagation mechanism matters is precisely where the models disagree, and this article deliberately does not settle it: the real business cycle model treats fluctuations as efficient responses to productivity shocks, while Kaldor’s trade cycle model generates turning points endogenously from a nonlinear investment function. The four phases described here are the anatomy that every such model is trying to explain.
The third error is the quiet one, and it hides inside the dashed line. Drawing the cycle as a deviation from trend suggests the trend is an independent path the economy returns to, so that a recession borrows output and a recovery repays it. Potential output is itself an estimate, revised often and heavily, and there is real evidence that deep or long downturns damage it: skills decay while people are out of work, firms that would have invested do not, and part of the labor force that leaves during a slump does not return. If that channel operates, some of what looks like a temporary gap is a permanent loss, and the practical implication is uncomfortable for the diagram. The question of what a rising line does and does not tell you about living standards belongs to GDP growth; the point here is narrower, that the benchmark the cycle is measured against is a construction, not a fact, and the article that treats it as a fixed track has smuggled in an answer.
The Phase You Cannot See From Inside It
Everything above assumes the phases are known. In real time they are not, and the reasons are worth stating precisely because so much weak commentary comes from ignoring them. Output is measured quarterly, published weeks after the quarter closes, and then revised, sometimes enough to move a quarter from positive to negative or back. Employment arrives monthly and is also revised. Turning points are dated by committee, after the fact, using several series together, which is why the announcement that a recession began in a given month can land a year later, and why the announcement that one ended can arrive while the labor market still feels terrible. The familiar shortcut, two consecutive quarters of falling output, is a serviceable rule of thumb and not the definition; the fuller criteria, depth, diffusion, and duration, exist because an economy can shrink for two quarters without a broad decline in employment and income, and can suffer a violent broad decline that does not fit neatly into calendar quarters. Our guide to what counts as a recession works through the dating rules in detail, and our piece on how economists predict downturns covers why the forward-looking indicators, the yield curve among them, produce false alarms alongside their hits.
Two consequences follow, and both reach further than the statistics office. The first is about policy. If the data describing the economy arrives late and is then revised, and if the tools that respond to it work with a further lag of quarters, then stabilization policy is being aimed at a target whose position was last observed some time ago, which is the whole problem examined in our article on monetary policy lags. It is also why the argument about whether a central bank tightened too much is usually unresolvable at the moment people are having it. The second consequence is about geography, and it is the part most cycle explainers omit. The American cycle is not one country’s private weather. When the largest economy contracts, the shock leaves through four doors at different speeds: import demand falls, and an exporter in Vietnam or Mexico feels it within a quarter; the dollar and global risk appetite move, and borrowers in emerging markets find credit costlier and shorter, sometimes within days; commodity prices fall, which cuts the export earnings of producers and cuts the import bill of buyers, so the same event is a loss for one country and a relief for another; and remittances from migrant workers in the affected sectors soften, which lands directly on household budgets in South Asia and Central America with no institution in between. A household in Larkana can feel an American peak before an American statistical agency has confirmed it, which is a strange fact and a true one, and it is the reason the four phases are worth understanding by people who will never read the dating committee’s announcement.
MASEconomics Explains
3 economic concepts behind the business cycle
These concepts are explored in depth across our educational articles library.
Explore the MASEconomics BlogConclusion
The business cycle describes the broad, recurring movement of output, employment, income, and sales through expansion, a peak, contraction, a trough, and recovery. The phases are real and the vocabulary is useful, but the diagram that teaches them carries three distortions worth removing before the terms are used. The phases are not symmetric: expansions take years and climb gently, contractions take months and fall hard, and the difference comes from the asymmetry between committing and stopping. The phases are not periodic: no expansion is due to end because of its age, and the fluctuations come from irregular shocks working through an economy’s own structure. And the trend the cycle is measured against is an estimate that downturns can themselves move, so the picture of borrowed output faithfully repaid is an assumption rather than an observation.
The most practical correction is the last one. Nobody knows which phase they are in while they are in it. Output arrives late and gets revised, employment turns after the economy has already turned, and the official dates land months or years after the fact, which means every confident real-time claim about the current phase is a forecast wearing the clothes of a measurement. That is not a reason to discard the framework. It is a reason to use it the way it works best: as an anatomy of what happens and in what order, so that a hiring freeze, a widening credit spread, and a canceled capital project can be recognized as parts of one process rather than as separate pieces of bad news. The reader who holds the four phases and their real proportions in mind will read the next downturn faster than the calendar allows, and will also know exactly how much of that reading is inference.
Frequently Asked Questions
What are the four phases of the business cycle?
Expansion, when output, employment, income, and sales rise together; the peak, the turning point at which that rise stops and activity is at its highest; contraction, the broad decline that follows; and the trough, the low point at which the decline ends and recovery begins. Recovery is the opening stretch of the next expansion, the part that regains the level lost.
Is a recession simply two quarters of negative GDP growth?
That is a rule of thumb, not the definition. Official dating looks at depth, diffusion across sectors, and duration together, using output, employment, real income, and sales rather than one series. An economy can post two negative quarters without a broad decline in jobs and income, and can suffer a severe broad decline that does not align with calendar quarters.
How long does a business cycle last?
There is no dependable length. Post-war expansions have run from roughly a year to more than a decade, and contractions have typically lasted several months to a year and a half. The word cycle suggests a period that can be counted down, and the record does not support one: expansions end because something ends them, not because they have aged.
Why are recessions steeper than expansions?
Because stopping is cheap and reversible while committing is not. Firms can freeze hiring, cancel orders, and shelve capital projects immediately, and each of those decisions is another firm’s lost revenue, so the contraction spreads at the speed of a canceled order. Rebuilding runs on signed contracts, new credit approvals, and training, which take far longer.
Can anyone tell which phase the economy is in right now?
Not with certainty. Output is published weeks after the quarter and revised afterwards, employment turns late, and turning points are dated by committee well after they occur. Forward-looking indicators such as new orders, hours worked, credit spreads, and the yield curve give an early read, but each produces false signals, so real-time statements about the current phase are inferences rather than measurements.
Thanks for reading! The cycle is a slow climb interrupted by a cliff, and knowing that changes what a quiet quarter of canceled orders is telling you. Happy learning with MASEconomics