The Office for National Statistics estimated that real GDP grew by 0.5% in the three months to February 2026, while the International Monetary Fund projected 0.8% UK real GDP growth and 3.2% consumer price inflation for 2026. The UK economy is therefore expanding, but slowly, with services resilience offset by weak productivity, high public debt, expensive energy, and a trade model still adjusting to Brexit.
The United Kingdom remains one of the world’s largest advanced economies, with a floating currency, deep capital markets, a major financial centre in London, and a central bank that targets 2% inflation through Bank Rate and wider monetary operations. Its strengths are clear. Its structural constraints are also visible.
By 2026, the central economic issue will no longer be whether the UK survives the formal break with the European Union. The deeper issue is whether a services-led, high-debt, low-productivity economy can restore stronger real income growth while maintaining fiscal credibility and monetary stability.
Structure of the UK Economy
The United Kingdom is a high-income, services-dominated economy with global financial reach, a large public sector, a mature welfare state, and a flexible exchange rate. The IMF’s country profile lists the UK population at about 69.85 million and projects 2026 real GDP growth of 0.8%, with consumer prices rising by 3.2%. These figures place the UK among the major advanced economies, but below the growth rates normally associated with post-shock recovery.
The currency is sterling. The central bank is the Bank of England. The fiscal authority is HM Treasury, with independent fiscal forecasts provided by the Office for Budget Responsibility. The country’s economic geography is uneven. London and the South East anchor finance, professional services, technology, media, and high-value consumption. The Midlands and North retain advanced manufacturing clusters in automotive, aerospace, pharmaceuticals, machinery, and defence. Scotland adds energy, finance, whisky, higher education, and renewables. Wales and Northern Ireland have smaller but important manufacturing, public-sector, and cross-border trade roles.
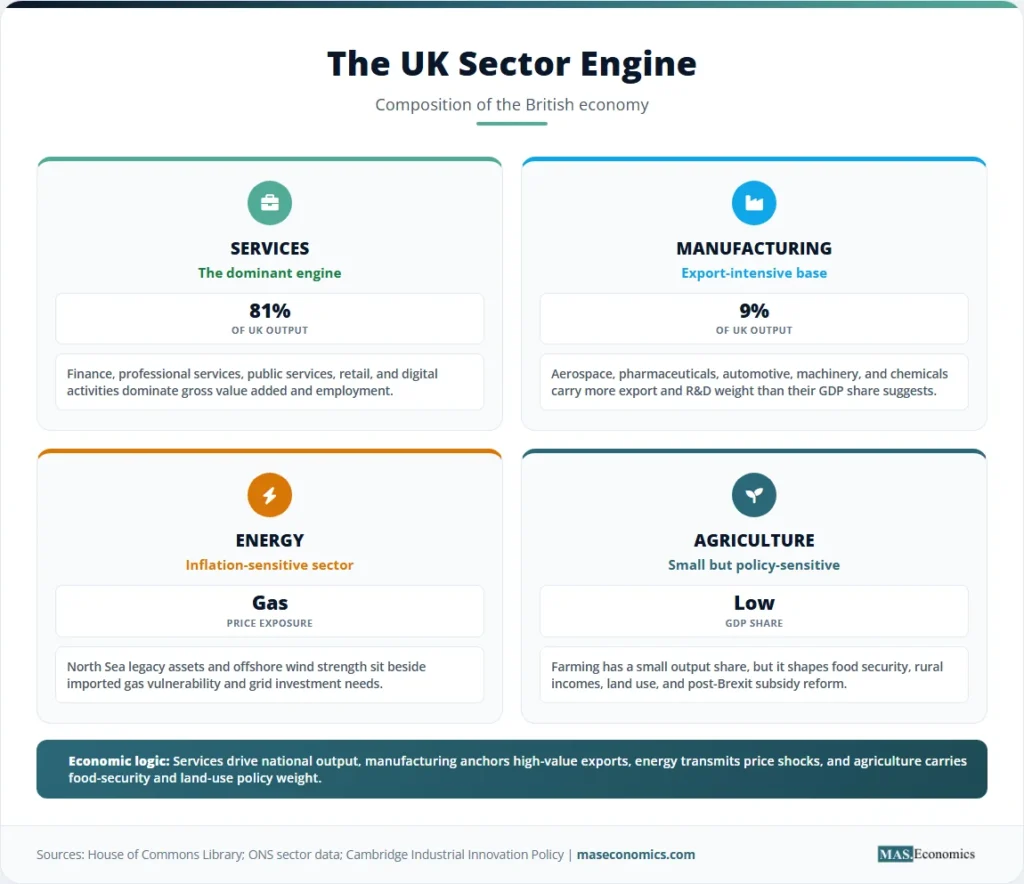
The dominant sector is services. Finance, insurance, legal services, consultancy, education, healthcare, retail, hospitality, real estate, and digital activities account for most output and employment. Manufacturing is smaller than in Germany or Japan, but it remains important because it carries export intensity, research content, and regional employment weight. Agriculture is economically small, though politically and socially important because it links land use, food security, rural incomes, and environmental policy.
The UK’s largest trading relationships remain tied to the United States and the European Union. The United States is the most important single-country partner across goods and services, while the EU remains central for goods trade because of geography, supply chains, and regulatory proximity. ONS trade data for February 2026 showed a goods deficit of £20.4 billion excluding precious metals, with goods exports of £31.5 billion and goods imports of £51.9 billion. The Department for Business and Trade reported that UK goods exports to the EU were £182.3 billion in the 12 months ending February 2026, close to 47% of total UK goods exports.
This mix creates the UK’s defining economic profile: a globally connected services economy with strong institutional capacity, persistent external deficits in goods, high dependence on imported energy and manufactured inputs, and a post-Brexit trade settlement that has raised frictions with its nearest large market.
Historical Origins of the Modern UK Economy
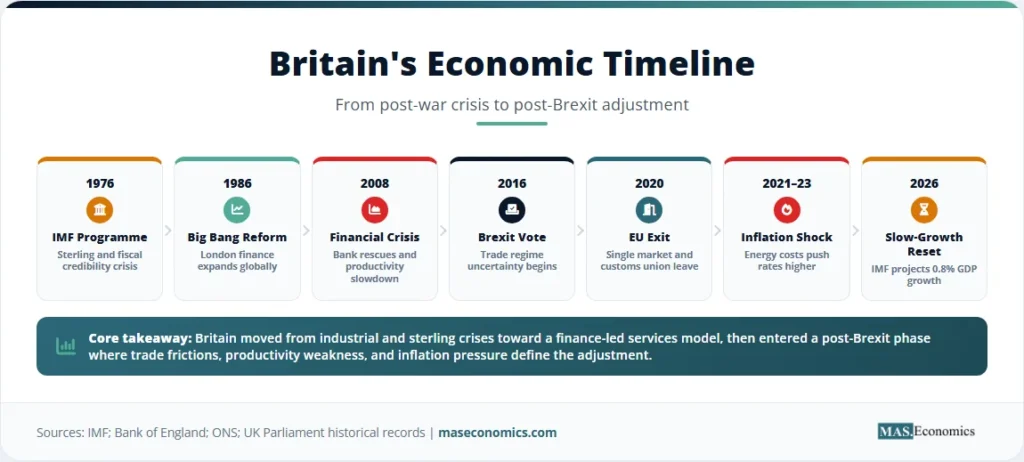
The modern UK economy cannot be understood through one event. It is the result of several shifts: the decline of empire, the post-war welfare settlement, deindustrialisation, the rise of finance, European integration, inflation shocks, and Brexit.
After the Second World War, Britain combined a large public sector with nationalised industries, capital controls, and a growing welfare state. The model delivered security and reconstruction, but it also struggled with weak productivity, repeated balance-of-payments pressure, and inflation. Sterling crises were not abstract financial episodes. There were signs that the UK was trying to maintain global commitments while its industrial base and export performance were weakening.
The 1970s exposed the pressure. Oil shocks, wage-price conflict, industrial disputes, and high inflation damaged confidence in the post-war model. The 1976 IMF programme became a symbolic turning point because it showed that a reserve-currency country with deep institutions could still face external financing constraints. The lesson was direct: fiscal choices, inflation expectations, and exchange-rate credibility could not be separated.
The 1980s shifted the economy toward market liberalisation, privatisation, weaker union power, financial deregulation, and tighter monetary discipline. The City of London expanded rapidly after the “Big Bang” financial reforms of 1986. Finance became a major export engine. The cost was regional divergence. Former industrial communities faced plant closures, employment scarring, and lower investment. Britain became richer in aggregate, but growth became more geographically concentrated.
European integration then shaped goods markets, standards, labour mobility, investment decisions, and supply chains. Membership of the European Economic Community, and later the European Union, gave firms access to a large nearby market. It also tied the UK to European regulatory frameworks. Britain kept sterling and stayed outside the euro, which preserved monetary sovereignty and avoided the constraints faced by euro-area economies during the sovereign debt crisis. The UK retained its own exchange rate and central bank while trading deeply with the single market.
The 2008 financial crisis changed the growth model again. A country with a large financial sector experienced a deep recession, bank rescues, public-debt expansion, and a long period of weak productivity. The Bank of England cut rates sharply and used quantitative easing. Fiscal policy moved from emergency stimulus to austerity. Real wages stagnated for many workers, and public services faced pressure after years of tight spending.
Brexit then added a new structural shock. The 2016 referendum created years of uncertainty before the UK formally left the EU and entered the Trade and Cooperation Agreement framework. Goods trade remained tariff-free for many products, but customs declarations, rules of origin, regulatory divergence, services restrictions, and mobility limits increased economic friction. The UK did not become a closed economy. It became a more administratively complex economy.
COVID-19, the energy shock after Russia’s invasion of Ukraine, and the inflation surge of 2021–2023 then layered new pressures onto the Brexit adjustment. By the mid-2020s, the UK economy had returned to growth, but not to dynamism. The central question became productivity. Without faster output per hour, neither real wages nor public services can improve sustainably.
Services Carry the Economy
The UK is often described as a services economy, but that phrase hides important differences across sectors. Financial services, professional services, education, health, retail, logistics, real estate, hospitality, creative industries, and public administration do not respond to the same shocks. Some export globally. Others depend on domestic incomes, public funding, or local demand.
London’s financial sector remains the clearest international strength. Banking, insurance, asset management, foreign exchange, derivatives, law, accounting, and consulting make the UK a major hub for global capital allocation. This is why the UK often runs a services surplus even while it runs a goods deficit. Services exports partially offset imported goods, energy, vehicles, machinery, electronics, and consumer products.
Professional and business services reinforce that position. Legal services, consultancy, engineering design, advertising, architecture, and accounting benefit from English law, time-zone placement, universities, and deep labour markets. These sectors also connect to the globalization of business services, where value comes from knowledge, contracts, data, and trust rather than physical shipment alone.
Manufacturing is smaller as a share of GDP, but still important for productivity and exports. Aerospace, pharmaceuticals, automotive, chemicals, food processing, advanced machinery, defence, and medical devices remain high-value sectors. Their challenge is scale. Britain has strong firms and research institutions, but weaker domestic supply-chain depth than larger industrial economies. Energy costs and investment uncertainty make this harder.
The automotive sector shows the trade-off clearly. It is export-intensive and regionally important, but it faces pressure from electric-vehicle transition costs, battery supply chains, global competition, and changing rules of origin. The economics of electric vehicles have therefore become a direct issue for UK industrial policy, not just a climate-policy topic.
Energy is another strategic sector. The UK has North Sea oil and gas legacy assets, growing offshore wind capacity, and ambitious decarbonisation targets. Yet it remains exposed to global gas prices and electricity-cost pressure. The energy shock after 2021 showed how imported price movements can feed domestic inflation, public subsidies, and business costs. That makes energy price shocks part of the UK’s macroeconomic structure.
Agriculture contributes a small share of national output, but food production, land management, rural incomes, and import dependence make it politically important. Post-Brexit agricultural policy replaced the Common Agricultural Policy with domestic schemes that combine farm support, environmental targets, and land-use reform. The economic weight is small, but the policy complexity is large.
The public sector is also central. Health, education, defence, transport, local government, welfare administration, and public infrastructure affect productivity directly. A congested transport system, long health waiting lists, weak local government finances, and underinvestment in skills all reduce economic capacity. Fiscal debates in Britain are therefore not only about deficits. They are about whether public spending raises the economy’s supply side or merely covers rising costs.
Monetary and Fiscal Framework
The UK uses a floating exchange rate. That gives monetary flexibility but also exposes the economy to sterling movements. A weaker pound can support exports in principle, but the UK imports energy, food, intermediate goods, and consumer products. Depreciation can therefore raise inflation before it improves the trade balance. The Marshall-Lerner condition and the J-curve effect are especially relevant to Britain because import costs often adjust faster than export volumes.
The Bank of England’s monetary framework is built around a 2% inflation target. The Monetary Policy Committee sets Bank Rate and can use balance-sheet tools when financial conditions require them. In April 2026, the Bank of England maintained the Bank Rate at 3.75%, while its Monetary Policy Report said headline GDP growth was expected to have been stronger in 2026 Q1, helped by a high monthly growth rate in February.
The post-2021 inflation episode changed the policy environment. For many years after the financial crisis, the UK faced low rates and weak demand. The challenge was stimulating growth without creating financial excess. After the inflation surge, the challenge became different: bringing inflation back toward target without crushing a weak productivity economy. That trade-off connects directly to central bank interest rate decisions and the long lags in monetary transmission.
Fiscal policy is constrained by debt, debt interest, public-service pressure, and market credibility. The OBR’s March 2026 Economic and Fiscal Outlook projected real GDP growth to slow from 1.4% in 2025 to 1.1% in 2026, before averaging 1.6% later in the forecast. It also linked the medium-term outlook to weak productivity growth and slower labour-supply growth as migration falls and population ageing continues.
That matters because Britain’s fiscal position is not only a matter of annual borrowing. It depends on the relationship between growth, interest rates, inflation, and the maturity structure of public debt. When gilt yields rise, debt-service costs rise. When growth disappoints, tax receipts weaken. When inflation stays high, welfare uprating and public-sector wage pressure increase. This is why debt sustainability is now part of mainstream UK macroeconomic debate.
The September 2022 gilt-market shock left a lasting mark. It showed that markets can reprice fiscal risk quickly when policy announcements appear inconsistent with debt stability. The episode also showed the interaction between pension funds, liability-driven investment strategies, bond yields, and central-bank liquidity operations. The UK did not face a classic emerging-market crisis. It faced an advanced-economy credibility shock in a deep bond market.
By 2026, the fiscal challenge is more conventional but still difficult. Public services require funding. Defence spending has risen in importance. Net-zero investment requires public and private capital. The tax burden is high by recent UK historical standards. Growth is modest. A government that borrows too freely risks higher gilt yields. A government that cuts too deeply risks weaker public capacity and lower long-run growth.
Trade After Brexit
Trade is the clearest channel through which Brexit changed the UK economy. The UK left the EU single market and customs union, which restored formal policy autonomy but introduced frictions into the country’s largest nearby trading relationship. The result is not a simple collapse. It is a slower, more costly trading environment for many firms, especially smaller exporters that lack compliance departments.
ONS trade data for February 2026 showed total goods exports of £31.5 billion and goods imports of £51.9 billion excluding precious metals, leaving a monthly goods deficit of £20.4 billion. Imports rose from both EU and non-EU countries. The Department for Business and Trade reported that goods exports to the EU were £182.3 billion in the 12 months ending February 2026, down 1.1% on the previous 12 months, while goods exports to non-EU countries were £203.5 billion, down 1.5%.
The UK’s trade model is therefore split. Goods trade remains deeply tied to Europe. Services trade has a wider global reach. The United States is especially important because UK services exports to the US are large, profitable, and less exposed to border frictions than goods. This is why the US UK economic relationship matters more than a narrow goods-only view suggests.
Post-Brexit trade policy has tried to diversify beyond Europe through agreements with Australia, New Zealand, the Comprehensive and Progressive Agreement for Trans-Pacific Partnership, and bilateral initiatives. These agreements may help specific sectors, but geography still matters. The gravity model of trade predicts that nearby large markets trade more with each other because distance raises costs. Brexit did not repeal that basic economic force.
The current account gives a broader picture. ONS balance-of-payments data showed the current account deficit, including precious metals, widened to £18.4 billion, or 2.4% of GDP, in Q4 2025. Excluding precious metals, the underlying current account deficit narrowed to £8.4 billion, or 1.1% of GDP. These figures point to a familiar UK pattern: goods deficits, services strength, volatile income flows, and continuing reliance on foreign capital inflows.
The chart shows why the UK’s problem is structural rather than purely cyclical. Growth is positive, but modest. A one-year rebound does not solve a decade of weak productivity, thin business investment, regional inequality, and public-capital pressure. For a country with high public expectations and an ageing population, growth near 1% leaves little room for fiscal comfort.
Britain’s Structural Tests
The UK’s most important economic constraint is productivity. Output per hour has grown slowly since the financial crisis. This has reduced real-wage growth, weakened tax revenues, and made fiscal trade-offs harsher. Productivity weakness has many causes: low business investment, skills mismatches, planning constraints, infrastructure gaps, regional inequality, management quality, and the long tail of low-productivity firms.
Business investment has been a chronic concern. Brexit uncertainty, tax changes, weak demand, and policy instability all reduced the incentive to commit capital. Lower investment then feeds weaker productivity. The mechanism is direct. Firms that do not invest in machinery, software, research, training, logistics, and energy efficiency cannot raise output per worker at the pace needed for stronger living standards.
Regional divergence is the second test. London’s productivity, wages, and asset prices sit far above many regions. The UK has world-class universities, financial markets, and research clusters, but the benefits do not spread evenly. Transport links, housing constraints, local government capacity, and skills systems affect whether private investment reaches weaker regions. A country can have national growth while many places feel stagnant.
Housing is the third test. Expensive housing reduces disposable income, raises labour costs in high-productivity cities, limits worker mobility, and increases inequality between asset owners and renters. The economics of housing affordability is therefore a supply-side issue, not only a social issue. Planning reform, infrastructure funding, mortgage rates, and local incentives shape labour-market efficiency.
Demographics form the fourth test. Population ageing raises pension and health spending while reducing labour-force growth. The OBR expects labour-supply growth to slow as net migration declines and ageing continues. Higher participation among older workers, better health outcomes, childcare access, skills investment, and productivity growth can offset some of this pressure. Without such offsets, fiscal strain rises.
Energy and climate transition from the fifth test. The UK has strong offshore wind potential and a serious decarbonisation framework, but industrial electricity costs and grid constraints remain obstacles. Green investment can support growth if it reduces energy dependence and improves productivity. It can become a cost burden if planning delays, network bottlenecks, and policy reversals raise uncertainty.
The sixth test is institutional credibility. Britain’s institutions remain strong by global standards: independent statistics, an independent central bank, deep courts, liquid bond markets, and a rules-based fiscal framework. But credibility is not permanent. It is maintained through consistent policy, realistic budgets, clear mandates, and a political system capable of making long-term investment decisions.
| Metric | Latest reading | Economic meaning |
|---|---|---|
| Real GDP momentum | 0.5% growth in the three months to February 2026 | Output was expanding, helped by services and production, but quarterly momentum remained modest. |
| IMF 2026 GDP projection | 0.8% real GDP growth | The international baseline points to slow expansion rather than a strong post-shock recovery. |
| Inflation outlook | 3.2% projected consumer price inflation in 2026 | Price pressure remains above the Bank of England’s 2% target, limiting room for rapid easing. |
| Bank Rate | 3.75% in April 2026 | Monetary policy is still restrictive compared with the low-rate period after 2008. |
| Goods trade balance | £20.4 billion deficit in February 2026, excluding precious metals | The UK remains structurally dependent on imported goods, partly offset by services exports. |
| Current account | 2.4% of GDP deficit in Q4 2025, including precious metals | External financing remains part of the UK macroeconomic model. |

|
||
Outlook for the 2026s
The UK’s outlook is best described as constrained resilience. The economy is not collapsing. It has strong services exports, credible institutions, deep capital markets, leading universities, and a globally recognised legal system. Yet resilience is not the same as dynamism. The growth rate remains too low to make fiscal pressure disappear.
Inflation is the first near-term constraint. If price growth stays above target, the Bank of England has less room to cut rates. Higher rates feed into mortgages, business borrowing, commercial property valuations, and gilt debt-service costs. Monetary policy cannot build houses, train workers, or raise productivity directly. It can only manage demand and expectations. Supply-side repair must come from investment, planning, skills, trade efficiency, and infrastructure.
Fiscal policy is the second constraint. The government must fund public services, defence, health, pensions, climate investment, and infrastructure while maintaining market confidence. The UK can borrow in its own currency, but that does not remove the budget constraint. Bond investors price inflation risk, growth risk, political risk, and fiscal credibility. The sovereign debt sustainability debate applies to advanced economies as well as emerging markets.
Trade policy is the third constraint. The UK can sign new agreements, but the EU remains geographically and economically central. Any improvement in UK-EU arrangements that reduces paperwork, supports services access, improves professional mobility, or stabilises regulatory expectations would help. Full single-market membership is a political question, but lower trade frictions are an economic gain.
Industrial strategy is the fourth constraint. Britain has strengths in life sciences, universities, defence technology, offshore wind, financial services, creative industries, artificial intelligence research, and advanced manufacturing niches. Turning these into broad-based productivity growth requires scale-up capital, stable incentives, procurement discipline, and infrastructure delivery. It also requires avoiding a narrow focus on fashionable sectors while neglecting logistics, housing, skills, and energy costs.
The broader global environment adds risk. Tariff escalation, energy shocks, Middle East disruption, US-EU trade conflict, China’s slowdown, and financial-market volatility all affect a mid-sized open economy. The UK is not insulated from the global tariff war, energy markets, or dollar funding conditions. Openness remains a strength, but it also transmits shocks.
The most realistic path to stronger UK growth is not a single reform. It is a package: higher business investment, credible fiscal rules, stable tax treatment of capital, better planning, faster grid connections, stronger technical education, improved health outcomes, lower trade frictions, and public investment that raises private-sector productivity. The US economy and the Eurozone economy face different institutional constraints, but the UK’s specific challenge is clear: it has monetary sovereignty and flexible markets, yet not enough productivity growth.
MASEconomics Explains
4 economic concepts behind the UK economy
These concepts are explored in depth across our educational articles library.
Explore the MASEconomics BlogConclusion
UK economy conditions in 2026 show an advanced economy with durable strengths and persistent structural limits. Services exports, sterling flexibility, deep finance, strong universities, and credible institutions remain major assets. Slow productivity growth, high housing costs, public-debt pressure, energy exposure, weak investment, and post-Brexit trade frictions remain the main constraints. The United Kingdom’s economic future depends on whether these constraints are treated as long-run supply problems rather than short-run political talking points.
Frequently Asked Questions
What drives the UK economy?
The UK economy is mainly driven by services, especially finance, professional services, healthcare, education, retail, hospitality, technology, and creative industries. Manufacturing is smaller than services, but it remains important for exports, research, regional employment, and productivity. London is the main financial centre, while other regions contribute through energy, aerospace, pharmaceuticals, automotive production, universities, and public services.
How did Brexit affect the UK economy?
Brexit changed the UK economy by increasing trade frictions with the European Union, especially through customs checks, rules of origin, regulatory paperwork, and limits on labour mobility. The largest long-term effects operate through trade, investment, supply chains, and productivity. The UK still trades heavily with Europe, but the relationship now carries more administrative cost than it did inside the single market and customs union.
Why is productivity so important for the UK economy?
Productivity measures how much output is produced from each hour of work or each unit of capital. It matters because higher productivity allows real wages, tax revenues, public services, and living standards to rise without relying only on higher borrowing or higher inflation. The UK’s weak productivity performance since the financial crisis is one reason growth, wages, and fiscal capacity have remained under pressure.
What role does the Bank of England play in the UK economy?
The Bank of England is the United Kingdom’s central bank. Its main monetary policy role is to keep inflation low and stable, using Bank Rate and other tools to influence borrowing costs, demand, and inflation expectations. It also supports financial stability by monitoring risks in the banking system and acting as a lender of last resort during periods of stress.
Why does the UK often run a goods trade deficit?
The UK often imports more goods than it exports because it buys large amounts of energy, machinery, vehicles, electronics, food, and consumer products from abroad. This goods deficit is partly offset by strong services exports, especially finance, insurance, legal services, consulting, education, and digital services. The result is a trade model where services strength helps compensate for manufacturing and goods-import dependence.
Thanks for reading! If you found this helpful, share it with friends and spread the knowledge. Happy learning with MASEconomics