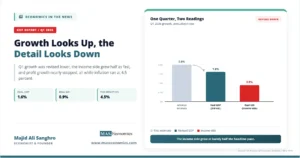
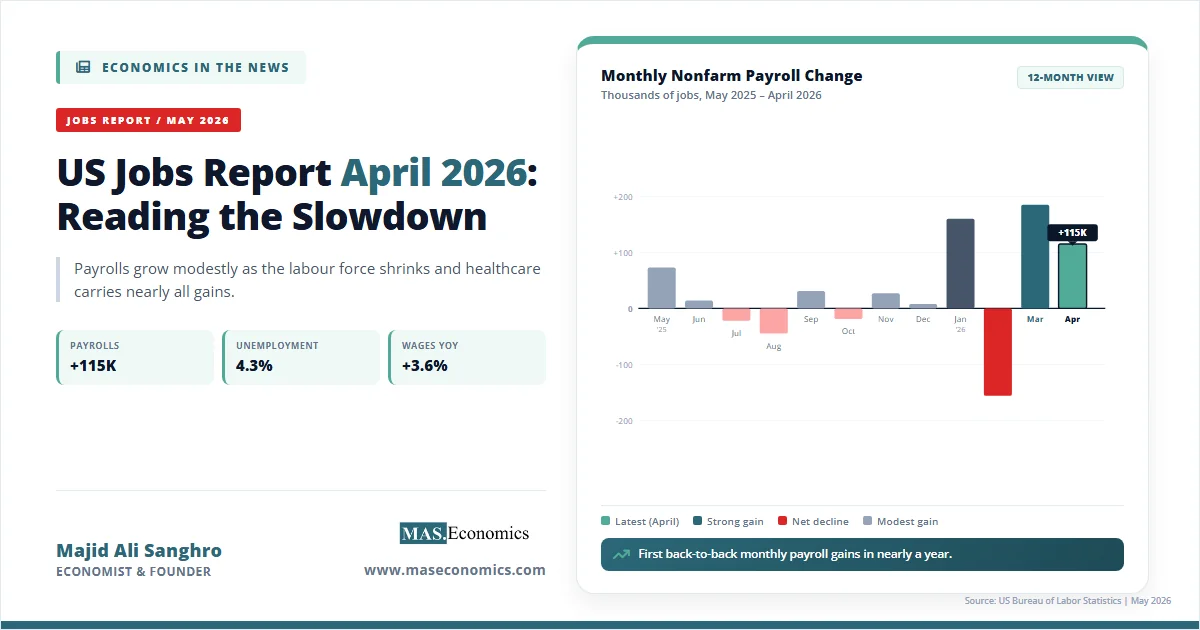
The US economy entered 2026 at roughly $32 trillion in nominal GDP, larger than China, Germany, and India combined. Real GDP grew at a 2.0 percent annual rate in the first quarter, according to the Bureau of Economic Analysis’s advance estimate, after expanding just 0.5 percent in the final quarter of 2025. Unemployment held at 4.3 percent in April 2026, with payrolls rising by 115,000 jobs. Federal debt held by the public stood near 100 percent of GDP, and the Congressional Budget Office projects a fiscal year 2026 deficit of $1.9 trillion, or 5.8 percent of GDP.
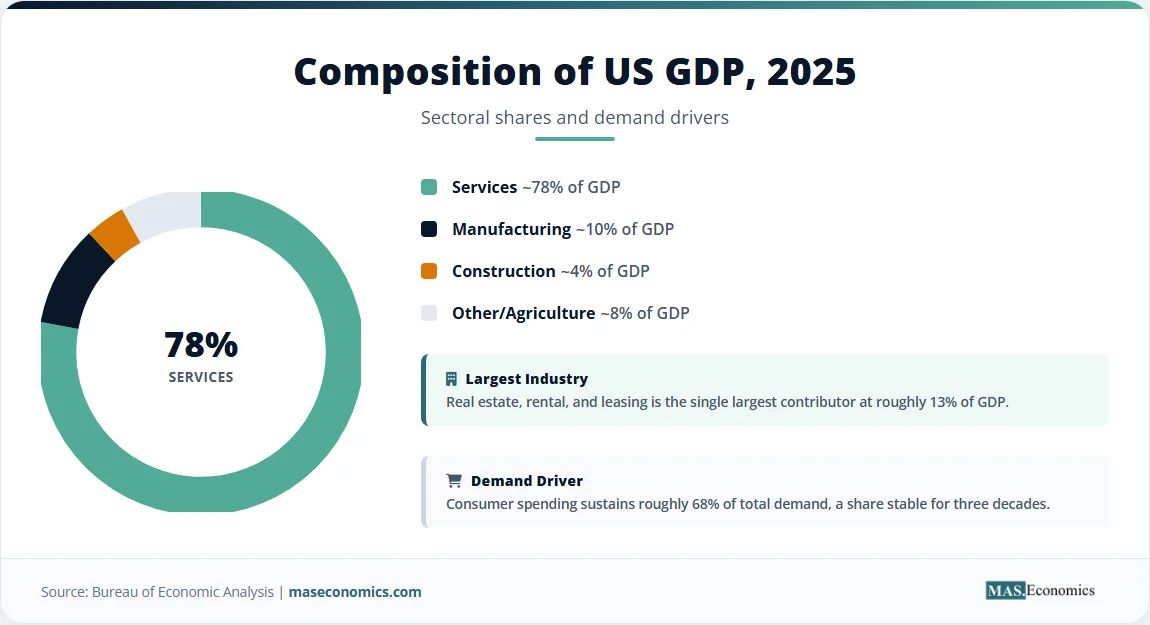
The US economy rests on three structural pillars: services constituting roughly 78 percent of output, household consumption driving 68 percent of demand, and the dollar acting as the dominant reserve currency. These features explain both the economy’s resilience and its accumulated strains. Persistent fiscal deficits, a shrinking labour force participation rate, and a goods trade deficit above $1.27 trillion in 2025 mark the widening cracks that will frame the policy debate of the coming decade.
The Output Structure of the US Economy
The United States produces roughly a quarter of global output with about 4 percent of the world’s population. IMF projections place 2026 nominal GDP at $32.4 trillion, more than 50 percent larger than the second-ranked Chinese economy at $20.8 trillion in nominal terms. Per-capita income runs above $86,000, placing the country in the top tier of large economies on income measures.
The composition of output explains why the United States rebounds from shocks faster than most peers. Services contribute roughly 78 percent of value added, manufacturing about 10 percent, construction about 4 percent, and agriculture under 1 percent. Within services, real estate, finance and insurance, professional and business services, government, and healthcare are the largest blocks. Within goods, chemicals (including pharmaceuticals), food and beverage, and computer and electronic products are the largest manufacturing subsectors.
Consumer spending remains the dominant engine. Personal consumption expenditures account for roughly 68 percent of GDP, a share that has stayed remarkably stable for three decades. Business investment, government purchases, and net exports fill the rest, with net exports persistently negative because the country imports more goods than it ships abroad.
Three structural advantages keep the United States at the top of the global ranking. First, deep and liquid capital markets channel domestic and foreign savings into business investment at a scale no other country matches. Second, the dollar is the dominant reserve currency, which lowers borrowing costs and gives Washington unique policy flexibility. Third, research and development spending runs above 3.4 percent of GDP, with manufacturers funding more than half of all private R&D, and pharmaceuticals alone driving over a third of manufacturing R&D.
The Historical Path to the Present
The path to today runs through a sequence of inflection points, each of which rewrote the economic playbook.
The Bretton Woods conference of 1944 made the dollar the anchor of the postwar monetary system, convertible to gold at $35 an ounce. That arrangement lasted until 1971, when President Nixon suspended convertibility, ushering in the era of floating exchange rates that still defines global finance. The transition is covered in depth in The Evolution of the International Monetary System.
The 1970s brought the great inflation, with consumer prices rising at double-digit rates after the 1973 and 1979 oil shocks. Federal Reserve Chairman Paul Volcker pushed the federal funds rate above 19 percent in 1981, breaking inflation but triggering back-to-back recessions. The episode established the modern doctrine of central bank independence, a topic explored in Understanding Central Bank Independence and Its Importance.
The 1980s and 1990s delivered the disinflation dividend. Real growth averaged above 3 percent, productivity accelerated as information technology spread, and the federal budget moved into surplus by the late 1990s. The Reagan tax cuts, the Tax Reform Act of 1986, and the deregulation of finance, telecoms, and transportation reshaped the institutional landscape.
The 2008 global financial crisis was the next rupture. Subprime mortgage defaults cascaded into a collapse of Lehman Brothers in September 2008, a 4.3 percent peak-to-trough fall in real GDP, and an unemployment rate that climbed to 10 percent. The Federal Reserve cut rates to near zero, launched quantitative easing, and acted as lender of last resort across the financial system. The full story is laid out in The 2008 Financial Crisis Explained.
Recovery from 2009 to 2019 was the longest expansion on record but the slowest in postwar history, averaging 2.3 percent real growth. The COVID-19 shock of 2020 produced a 9.1 percent peak-to-trough collapse in GDP within a single quarter, a $5 trillion fiscal response across the CARES Act and follow-up packages, and a Federal Reserve balance sheet that swelled past $9 trillion. The post-pandemic inflation surge that followed in 2021 and 2022 took CPI inflation above 9 percent, the highest reading since 1981, before aggressive monetary tightening brought it back toward target.
The 2025–2026 period has been shaped by a sweeping tariff regime, a fiscal package known as the One Big Beautiful Bill Act, and a contested Federal Reserve chair transition from Jerome Powell to Kevin Warsh. The tariff strategy is dissected in The Global Tariff War of 2025–2026.
What the US Economy Produces
Output is concentrated in a handful of industries that each generate over a trillion dollars of value added a year. Real estate, rental, and leasing is the single largest contributor at roughly 13 percent of GDP, reflecting the size of the residential and commercial property stock and the imputed rental value of owner-occupied housing. Manufacturing produced $2.95 trillion of value-added output in 2025, contributing about 9.5 percent of GDP according to the Bureau of Economic Analysis. Government, finance and insurance, and professional and business services each contribute over 10 percent.
The services share has risen steadily for sixty years, while manufacturing’s share of output has fallen even as absolute output has grown. The shift is the result of two forces: services demand has grown faster than goods demand as households got richer, and manufacturing productivity has risen faster than services productivity, so the same volume of physical goods is produced with fewer workers and a smaller GDP share.
Within manufacturing, three subsectors dominate. Chemicals, including pharmaceuticals and basic chemicals, lead by value added. Food and beverage products come second, reflecting both domestic consumption and export markets in agricultural processing. Computer and electronic products, which include semiconductors and aerospace electronics, come third. The semiconductor industry alone is the subject of a separate analysis in The Economics of the Semiconductor Industry.
Energy production has transformed in the past fifteen years. The shale revolution, beginning around 2010, made the United States the world’s largest producer of crude oil and natural gas. Net energy imports, which once exceeded 30 percent of consumption, fell to net exports by 2020. The change has reshaped trade balances, foreign policy options, and the cyclical sensitivity of the broader economy to oil shocks. The mechanics are covered in Oil Price Shocks: Why Energy Crises Keep Coming Back.
The technology sector deserves separate treatment. The seven largest tech firms by market capitalisation were collectively worth more than the entire equity markets of every country except the United States and China combined as of early 2026. Their capital spending on data centres, chip fabrication, and AI infrastructure has become a meaningful contributor to aggregate investment, a dynamic explored in The AI Productivity Paradox.
Agriculture employs about 1 percent of the labor force but produces a large share of global commodity exports. The United States is the largest exporter of corn and soybeans, the second-largest exporter of beef, and a major exporter of wheat and dairy. Productivity per acre is the highest in the world, sustained by mechanisation, fertiliser use, biotechnology, and federal support programmes.
Monetary and Fiscal Institutions
The Federal Reserve System, established by the Federal Reserve Act of 1913, runs monetary policy. The Federal Open Market Committee meets eight times a year to set the federal funds rate target, the policy rate that anchors all other short-term interest rates. The Fed has a dual mandate of maximum employment and stable prices, with a 2 percent inflation target measured by the personal consumption expenditures price index. The institution’s structure, voting rules, and operations are covered in detail in the forthcoming Federal Reserve Explained profile and in The Functions of Central Banks.
The dollar is a freely floating fiat currency. There is no peg, no managed band, no announced exchange rate target. The Treasury has standing authority to intervene in foreign exchange markets through the Exchange Stabilization Fund, but interventions have been rare since the 1990s. The currency’s reserve status, with roughly 58 percent of allocated global foreign exchange reserves held in dollars according to IMF COFER data, gives Washington unique funding advantages.
Fiscal policy is set by Congress, with the President proposing budgets and the Treasury managing debt issuance. The federal government collects revenue chiefly from individual income taxes (about 50 percent of receipts), payroll taxes (about 35 percent), and corporate income taxes (about 10 percent). Spending is dominated by mandatory programmes (Social Security, Medicare, Medicaid), defence, and net interest. The framework is explained in Fiscal Policy: Key Objectives, Strategies, and Challenges Explained.
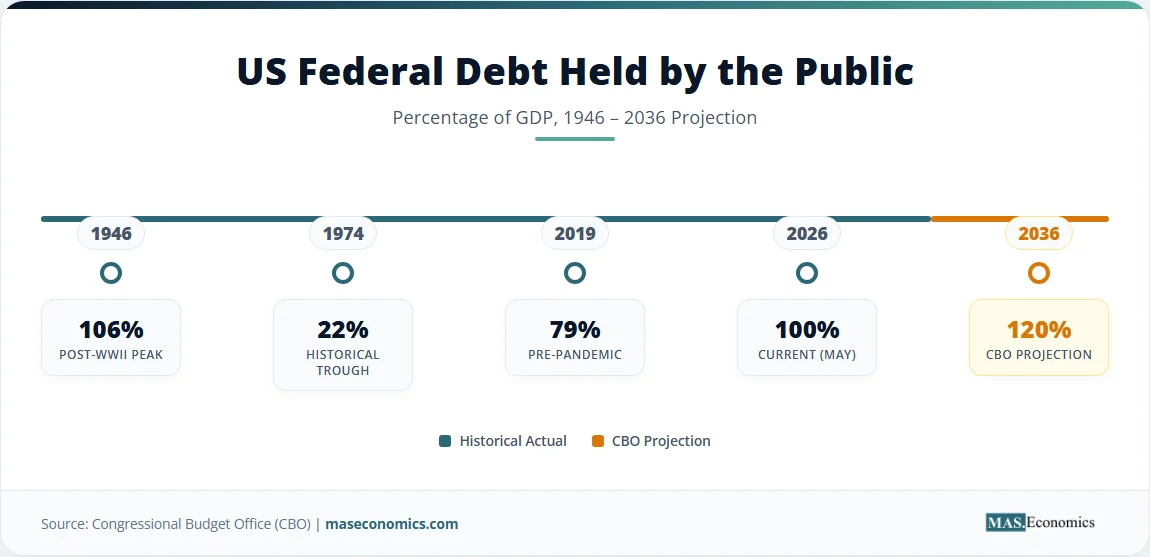
The fiscal position has deteriorated sharply since 2019. Federal debt held by the public stood at 79 percent of GDP at the end of 2019. By the end of 2024, it was 98 percent of GDP. By 2026, it is at or above 100 percent and on a path the Congressional Budget Office projects reaches 120 percent of GDP by 2036. Net interest payments on the debt now exceed defence spending, a threshold the country has not crossed since 1998. The implications for fiscal capacity are analysed in Sovereign Debt Sustainability.
The interaction between fiscal and monetary policy has tightened. As deficits stay near 6 percent of GDP, the Treasury issues record volumes of bills and notes. The Federal Reserve, having embarked on quantitative tightening, is no longer absorbing that supply. Foreign central banks, particularly Japan and China, have reduced their net Treasury purchases. The result has been higher term premia and a steeper yield curve, dynamics covered in Yield Curve Explained: What Bond Markets Tell Us.
The United States in the Global Economy
Total trade in goods and services reached record levels in 2025 at $3.4 trillion in exports and $4.3 trillion in imports, according to Census Bureau balance-of-payments data. The goods trade deficit ran near $1.27 trillion through the first eleven months of 2025, partly offset by a services surplus of $336 billion. The persistence of large goods deficits despite competitive industries and a strong currency reflects three structural facts: high domestic consumption, low household saving, and the dollar’s reserve status, which keeps the currency stronger than trade flows alone would justify.
The top three trading partners account for over 40 percent of total trade. Mexico became the largest trading partner in 2023, displacing China, after USMCA implementation and tariff-driven supply chain shifts. Canada is consistently second, tied to integrated automotive, energy, and agricultural supply chains. China has fallen to third for total trade and second for imports, with both shares declining as tariffs and export controls reshape sourcing.
| Trading Partner | Total Trade 2024 ($bn) | US Imports From ($bn) | US Exports To ($bn) |
|---|---|---|---|
| Mexico | 840 | 506 | 334 |
| Canada | 773 | 413 | 360 |
| China | 575 | 439 | 136 |
| Germany | 252 | 160 | 92 |
| Japan | 228 | 148 | 80 |
| South Korea | 198 | 132 | 66 |
| Vietnam | 149 | 137 | 12 |
| Taiwan | 158 | 116 | 42 |
| United Kingdom | 148 | 68 | 80 |
| India | 129 | 87 | 42 |
 | |||
Source: US Census Bureau, USTR. Figures are the total goods trade for the calendar year 2024.
The composition of trade is asymmetric. Top exports are aerospace products, refined petroleum products, crude oil, motor vehicles, agricultural goods (especially soybeans and corn), and pharmaceuticals. Top imports are motor vehicles and parts, electronics and consumer goods, pharmaceuticals, machinery, and crude oil. Services exports, where the United States runs a structural surplus, are concentrated in financial services, intellectual property licensing, travel, and professional services.
The capital account complements the trade picture. Persistent current account deficits are matched by net capital inflows. Foreign holdings of US Treasury securities total roughly $8.5 trillion, or about a quarter of marketable debt outstanding. Foreign direct investment into the United States exceeded $5 trillion on a stock basis in 2025, with manufacturing, finance, and information services as the largest target sectors.
Figure 1. US trade with top partners, 2024. Source: US Census Bureau.
Structural Pressures in the US Economy
The headline numbers conceal a set of structural pressures that will shape the next decade of policy debate.
Demographics are tightening. The labor force participation rate stood at 61.8 percent in April 2026, well below the 67 percent peak reached in early 2000. The Bureau of Labor Statistics projects a further decline to 61.1 percent by 2034 as the population ages and the share of workers in lower-participation age brackets rises. Net immigration, which had been the main offset to slower native population growth, dropped sharply after the 2024 administration change, removing what had been a significant tailwind for labor supply. The mechanics of aging populations are explored separately.
Productivity growth has been uneven. After a long slowdown from 2005 to 2019 that averaged 1.4 percent, productivity rose at over 2 percent through 2023 and 2024, raising hopes of an AI-driven acceleration. The 2025 data softened that picture. Whether the productivity boom of the late 2020s materialises depends on how broadly artificial intelligence diffuses beyond the tech sector, a question covered in AI and the Economy.
Inequality remains elevated. The top 1 percent of households hold roughly a third of total wealth, and the bottom 50 percent hold under 3 percent. The Gini coefficient for income, after taxes and transfers, has hovered around 0.39 for two decades. Real wage growth at the median was negligible from 2000 to 2019, although it accelerated after 2020 as the labor market tightened. The structural drivers are analysed in Economics of Inequality: Gini, Lorenz, and the Top 1%.
The fiscal trajectory is the largest single vulnerability. Net interest costs reached $881 billion in fiscal 2024 and are projected to exceed $1 trillion in fiscal 2026, surpassing both defence and Medicare. Without policy change, debt-to-GDP rises from 100 percent today to 175 percent by 2056, according to CBO long-term projections. The country has unique advantages as the issuer of the global reserve currency, but those advantages are not unlimited.
Energy and climate transitions cut both ways. The shale revolution made the United States energy-independent and lowered industrial costs. The transition to electric vehicles and renewable power, accelerated by the Inflation Reduction Act and tempered by 2025 policy reversals, is creating new manufacturing investment at the same time as it strands legacy capital. The economics are laid out in The Economics of Electric Vehicles.
Geopolitical fragmentation poses a slower-burning risk. The dollar-based financial system has been weaponised through sanctions on Russia and, earlier, on Iran. That has accelerated efforts by China, BRICS members, and others to develop alternative payment rails. The dollar’s share of global reserves has drifted down from 71 percent in 2000 to 58 percent in 2024, according to IMF data, though no single rival has emerged. The dynamic is covered in Economic Sanctions: The Weapon That Does Not Fire a Shot.
| Structural Metric | Latest Value | Trend | Source |
|---|---|---|---|
| Federal debt held by public (% GDP) | ~100% | Rising; CBO projects 120% by 2036 | CBO, 2026 |
| Federal deficit (% GDP, FY2026) | 5.8% | Above historical average | CBO, 2026 |
| Labor force participation rate | 61.8% | Declining; projected 61.1% by 2034 | BLS, April 2026 |
| Total fertility rate | 1.62 | Below replacement (2.1) | CDC NCHS, 2024 |
| Productivity growth (5-yr avg) | ~1.8% | Mixed; AI impact uncertain | BLS, 2025 |
| Gini coefficient (post-tax) | ~0.39 | Stable at high level | Census, 2024 |
| R&D spending (% GDP) | 3.46% | Rising; manufacturers fund 51.8% | BEA / NSF, 2024 |
| Manufacturing share of GDP | 9.5% | Stable in dollars, declining in share | BEA, Q3 2025 |
| Goods trade deficit ($bn, 2025) | 1,270 | Persistent; partly offset by services | Census Bureau, 2025 |
| Dollar share of global reserves | ~58% | Drifting lower since 2000 | IMF COFER, 2024 |
| |||
Table 1. Key structural metrics for the US economy.
The combination of these pressures defines the policy debate. Faster productivity growth, higher labor force participation, tighter fiscal management, and a credible inflation track record at the Federal Reserve would together stabilise the trajectory. Persistent fiscal deficits, weakening institutional credibility, slower productivity, and continued global fragmentation would push the country toward harder choices in the second half of the 2030s. The forces that determine which path dominates are the subject of every news article in this series.
MASEconomics Explains
Four economic concepts behind the US economy
Conclusion
The US economy remains the largest in the world by nominal GDP, the most innovative by R&D intensity, and the most influential through the dollar’s reserve status. Services drive 78 percent of output, manufacturing produces $2.95 trillion of value added, and consumer spending sustains roughly 68 percent of demand. The fiscal position has crossed 100 percent of GDP for federal debt held by the public, with deficits projected near 6 percent of GDP through the next decade. Labor force participation is declining as the population ages, productivity growth is uneven, and the goods trade deficit ran above $1.27 trillion in 2025. Mexico, Canada, and China together account for more than 40 percent of total US trade. These structural facts will shape every news article in the Economics in the News series and every policy debate of the next decade.
Frequently Asked Questions
What makes the US economy so powerful?
The US economy is powerful because it combines a large domestic market, deep financial markets, high innovation capacity, strong universities, major technology firms, abundant natural resources, and the global role of the US dollar. Its scale allows firms to grow quickly, attract global capital, and spread fixed costs across a large consumer base. These strengths make the United States central to global trade, finance, technology, and monetary conditions.
Why is consumer spending important in the US economy?
Consumer spending is important because household consumption is the largest component of US demand. When households spend more, firms sell more goods and services, which supports employment, profits, investment, and tax revenues. When households cut spending, the slowdown can spread quickly through retail, housing, services, manufacturing supply chains, and financial markets.
What role does the US dollar play in the global economy?
The US dollar is the world’s main reserve currency and is widely used in trade invoicing, commodity pricing, foreign-exchange reserves, and international borrowing. This gives the United States unusually strong access to global capital markets. It also means Federal Reserve decisions can affect financial conditions far beyond the United States.
Why does US public debt matter?
US public debt matters because it affects interest costs, fiscal flexibility, bond markets, and long-term confidence in government finances. A large economy that borrows in its own currency has more room than most countries, but that room is not unlimited. Debt becomes more difficult to manage when interest costs rise faster than tax revenues or when investors demand higher compensation for fiscal risk.
What are the main strengths and weaknesses of the US economy?
The main strengths of the US economy are innovation, financial depth, labour-market flexibility, energy capacity, global firms, and the dollar’s international role. The main weaknesses include income inequality, high healthcare costs, large fiscal deficits, political polarisation, housing affordability pressure, and periodic financial instability. These strengths and weaknesses often appear together because the same market flexibility that supports innovation can also widen economic gaps.
Thanks for reading! If you found this helpful, share it with friends and spread the knowledge. Happy learning with MASEconomics