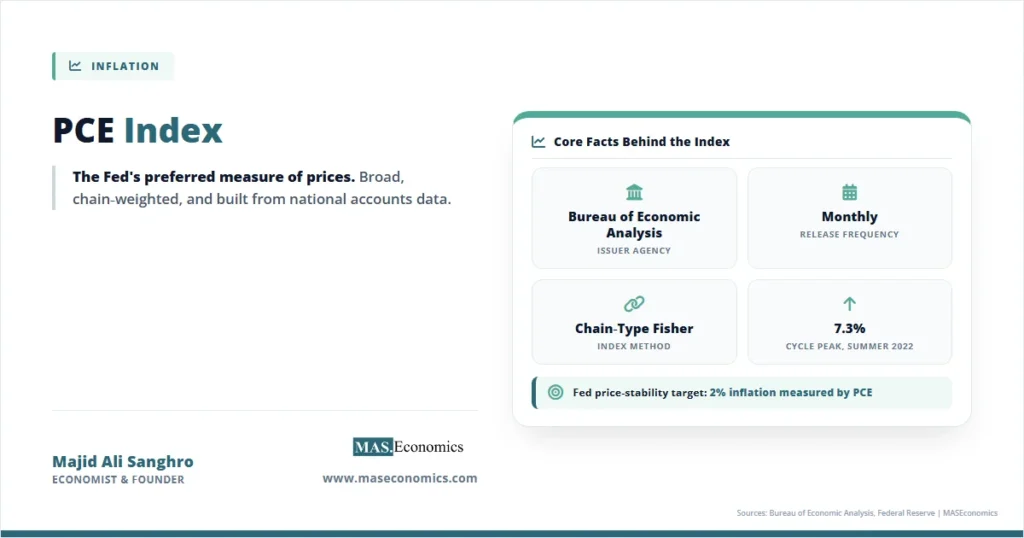
In March 2026, the Bureau of Economic Analysis reported that the PCE price index rose 3.5 percent from a year earlier, while core PCE rose 3.2 percent. PCE Index explained begins with the fact that the Federal Reserve’s inflation target is not written around CPI, but around the annual change in the personal consumption expenditures price index.
The PCE Index matters because it measures the prices paid by people living in the United States, or by others on their behalf, across a broad set of consumer goods and services. The BEA publishes it each month in the Personal Income and Outlays release, and the Federal Reserve uses it as the formal price measure for its 2 percent longer-run inflation objective.
Core definition: The PCE price index tracks changes in prices for personal consumption expenditures, including goods and services purchased directly by households and services paid on their behalf, such as employer-provided health insurance and government-financed medical care.
The Fed’s Preferred Price Measure
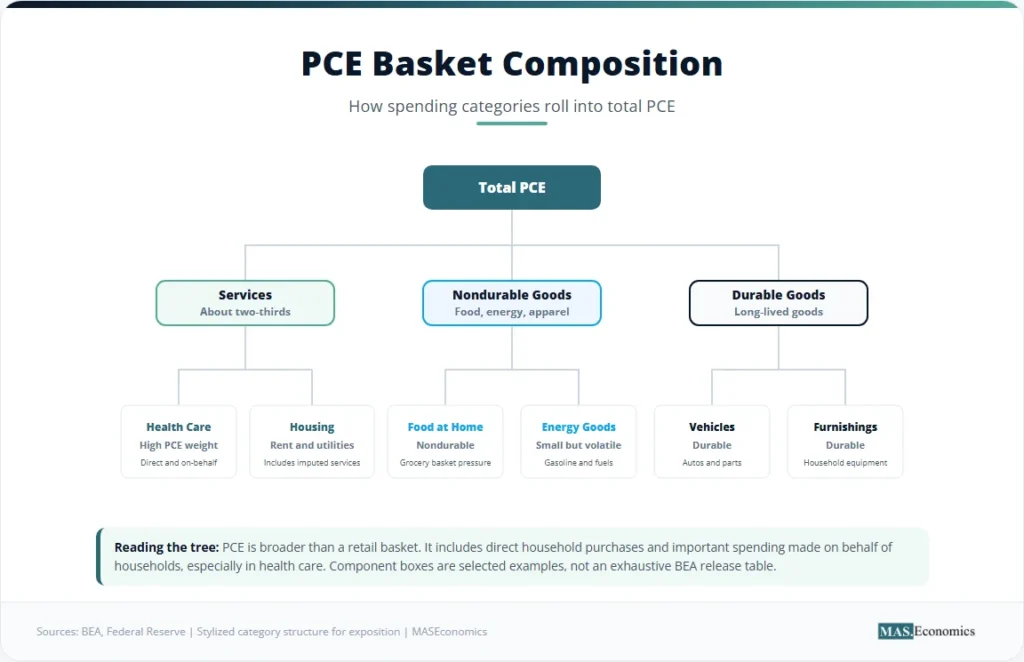
The Personal Consumption Expenditures price index is produced by the U.S. Bureau of Economic Analysis. It is part of the national income and product accounts, the same accounting system that produces GDP, personal income, and consumer spending. That position inside the national accounts explains why the PCE Index is broader than a retail price basket. It is not limited to out-of-pocket purchases at shops, supermarkets, rents, and transport services. It also includes expenditures made on behalf of households.
This broader scope matters most in health care. A household may pay only a fraction of the cost of medical care directly, while employers, Medicare, Medicaid, and private insurers pay the rest. CPI is designed around prices faced by urban consumers in out-of-pocket consumption. PCE captures the consumption flow more broadly. That is one reason the Federal Reserve, which sets monetary policy for the whole economy, treats PCE inflation as the main price-stability gauge.
The Federal Reserve’s Statement on Longer-Run Goals and Monetary Policy Strategy states that 2 percent inflation, measured by the annual change in the PCE price index, is most consistent with its statutory mandate. That connects the PCE Index directly to the dual mandate described in the MASEconomics profile of the Federal Reserve explained.
The PCE Index is also central to the Fed’s post-2020 strategy. Under Average Inflation Targeting, the relevant inflation concept is not a one-month price shock or a single CPI release. It is the path of inflation over time relative to the 2 percent objective. Because that objective is written in PCE terms, PCE is the language in which Fed officials describe whether price stability has been restored.
Chain Weighting and Consumer Substitution
The PCE Index differs from CPI in three main ways: scope, weights, and formula. The scope is broader because PCE includes purchases made on behalf of households. The weights differ because PCE draws heavily from business and administrative data inside the national accounts, while CPI relies more directly on household expenditure survey information. The formula differs because PCE is a chain-type Fisher index, while CPI has historically been closer to a fixed-basket Laspeyres framework.
The formula difference is not a technical decoration. A fixed basket treats the same consumption mix as the reference point, even when relative prices change. A chain-weighted index updates expenditure patterns more frequently. If beef prices rise and households substitute toward chicken, a chain-weighted index can reflect that shift more quickly. CPI still captures inflation, but the PCE formula is built to account more directly for substitution across categories.
The Bureau of Labor Statistics summarises the CPI-PCE gap through four effects: formula, weight, scope, and other differences. The BLS comparison of CPI and PCE notes that CPI and PCE are constructed differently and often behave differently over time. That makes PCE useful for monetary policy and CPI useful for household cost-of-living applications, especially where direct out-of-pocket expenses dominate.
| Category | Weight (%) | YoY Change | Contribution to Headline (pp) |
|---|---|---|---|
| Housing and utilities | 18.2 | 4.1% | 0.75 |
| Health care | 17.1 | 3.8% | 0.65 |
| Food services and accommodation | 7.1 | 4.0% | 0.28 |
| Financial services and insurance | 7.0 | 3.4% | 0.24 |
| Recreation services | 4.5 | 2.9% | 0.13 |
| Food and beverages at home | 7.1 | 2.4% | 0.17 |
| Gasoline and energy goods | 2.2 | 6.5% | 0.14 |
| Motor vehicles and parts | 4.0 | 1.8% | 0.07 |
| Furnishings and durable goods | 3.6 | 1.5% | 0.05 |
| Clothing and footwear | 2.4 | 2.2% | 0.05 |
| Other goods and services | 26.8 | 3.6% | 0.96 |
| Total PCE basket | 100.0 | 3.5% | 3.50 |

|
|||
The table uses stylised component weights to show the logic of PCE contributions. A category’s contribution is roughly its expenditure weight multiplied by its year-on-year price change. The exact BEA release uses detailed national-account categories, seasonal adjustment, chain-weighting, and revisions. The economic intuition is still straightforward: a small energy category can move headline inflation sharply when fuel prices swing, while a large services category can keep inflation elevated even when goods prices cool.
This is why PCE is not simply another name for CPI. It is a different measurement architecture. CPI is often the better measure for direct consumer price pressure. PCE is often the better measure for macroeconomic price pressure. A full inflation dashboard needs both, which is why PCE articles should link naturally to the MASEconomics CPI profile, A Closer Look at Consumer Price Index, and to broader primers such as Inflation Simply Explained.
From the 2000 Switch to 2022 Peak
The Fed’s preference for PCE became explicit in the early 2000s. The move reflected the index’s broader scope, its chain-weighted formula, and its ability to incorporate revisions as national-account information improves. That preference became more important after the Federal Open Market Committee adopted a formal 2 percent inflation objective in 2012 and then revised its framework in 2020 toward inflation that averages 2 percent over time.
The long-run history of PCE inflation shows why the distinction between headline and core matters. Headline PCE includes food and energy, so it responds quickly to oil shocks, food price spikes, and supply disruptions. Core PCE excludes food and energy, making it less volatile and more useful for detecting the underlying trend. The BEA describes core PCE as a measure that leaves out categories where prices tend to swing more sharply and more often than other prices.
The pandemic period exposed both sides of the index. In 2020, spending patterns shifted abruptly. Services spending fell sharply while goods demand rose. Supply chains, inventories, ports, energy markets, and labour availability all came under stress. A Federal Reserve research paper on inflation since the pandemic reported that 12-month PCE inflation reached 7.3 percent in the summer of 2022, a sharp break from the low-inflation decade before the pandemic.
The chart treats 2 percent as the policy reference line because the Fed’s longer-run objective is stated in PCE terms. During much of the 2010s, both headline and core PCE inflation ran below that objective. The 2021-2022 surge was different. Headline inflation moved first as energy, goods, and reopening-sensitive categories accelerated. Core PCE then became the more important signal because it showed whether inflation pressure had spread into persistent services categories.
That distinction also explains why monthly PCE releases often move markets even when CPI has already been published. CPI usually arrives earlier and captures a narrower price basket. PCE arrives later, incorporates more source data, and aligns directly with the Fed’s target. Bond yields, rate expectations, and equity valuations can therefore respond to PCE even when the broad inflation direction is already known from CPI.
PCE Against CPI and Core Measures
The difference between PCE and CPI is not that one is correct and the other is wrong. The difference is purpose. CPI is built around prices paid by urban consumers for a market basket of goods and services. PCE is built inside the national accounts and tracks the price of personal consumption expenditures. CPI is often more visible in wage indexation, Social Security cost-of-living adjustments, rent discussions, and public news coverage. PCE is more central to monetary policy.
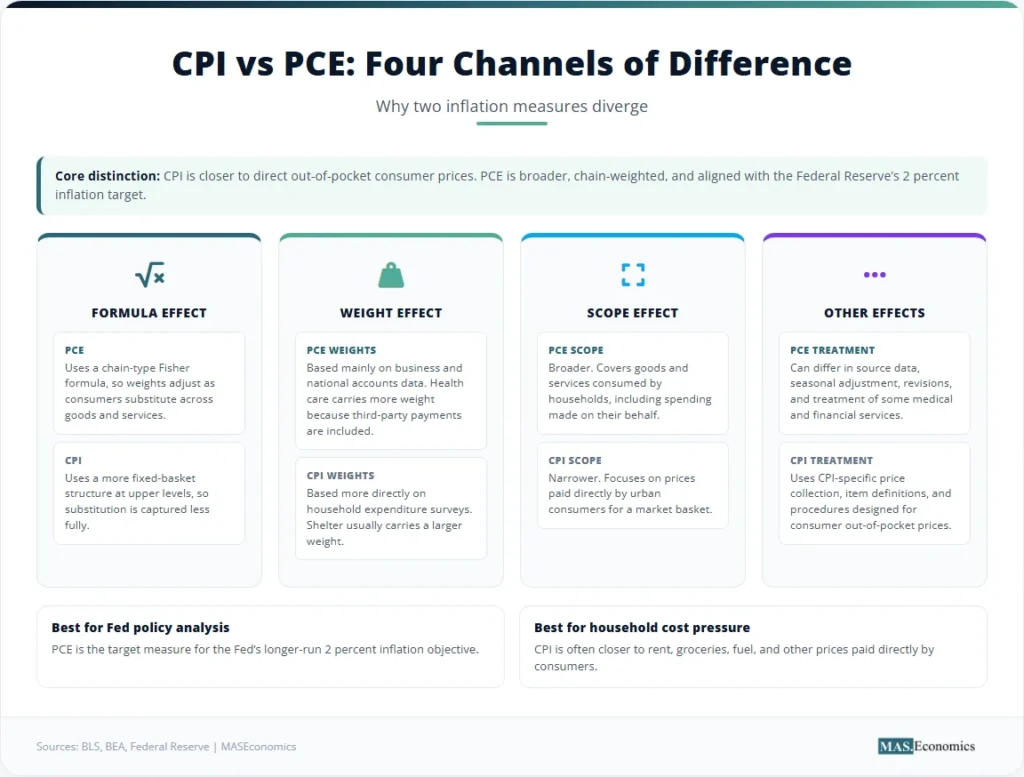
PCE tends to run below CPI over long periods because of formula and weight differences. Chain-weighting lets the PCE basket respond more quickly when consumers substitute away from items whose relative prices rise. PCE also gives different weights to medical care, shelter, and other services than CPI. Shelter has a larger role in CPI, while health care and other third-party-paid services have a larger role in PCE.
Core PCE is not the Fed’s formal target, but it is often the preferred signal for the inflation trend. The target refers to headline PCE because households consume food and energy. The analytical focus often turns to core PCE because food and energy can be moved by weather, geopolitics, refinery disruptions, and commodity cycles. That is why a single energy-driven decline in headline PCE does not automatically mean inflation has returned to target.
Other measures fill the same dashboard. The Dallas Fed’s trimmed mean PCE removes extreme monthly price changes rather than fixed categories. The Cleveland Fed’s median CPI identifies the middle of the weighted distribution. The Atlanta Fed’s sticky-price CPI separates prices that adjust slowly from prices that move frequently. These measures help interpret the same basic question: whether the economy is experiencing a temporary relative-price shock or broad inflation pressure.
The MASEconomics inflation cluster should treat PCE as the measurement anchor, not as a stand-alone article. It links backward to the causes of inflation, sideways to inflation expectations, and forward to new index profiles such as Core CPI, Trimmed Mean PCE, Sticky-Price CPI, Median CPI, and the New York Fed Underlying Inflation Gauge.
Where PCE Can Mislead
The PCE Index is broad and policy-relevant, but it is not a perfect cost-of-living measure. The same features that make it attractive for monetary policy can make it feel distant from household experience. A family facing a rent increase, a car insurance jump, or a grocery bill shock may experience inflation differently from the national PCE average.
First, PCE is revised. Because it sits inside the national accounts, the BEA updates estimates as better source data arrive. Revisions are useful for researchers and forecasters because they improve historical consistency. They can still complicate real-time policy interpretation. A central bank must act on the data available at the time, not on the later revised path.
Second, PCE weights follow aggregate spending, not every household’s budget. High-income households spend more in dollar terms, so aggregate expenditure weights can differ from the basket faced by lower-income households. This is one reason distributional inflation analysis matters. The same national PCE reading can coexist with very different lived inflation across income groups, regions, and age cohorts.
Third, core PCE can understate immediate pain when excluded categories dominate household budgets. Food and energy volatility may be poor guides to medium-term inflation, but they are not irrelevant. The analytical case for core inflation is about signal extraction, not social importance. A rise in fuel or food prices can still reduce real purchasing power even if core PCE remains stable.
Fourth, PCE can lag the first visible price shock. CPI often arrives earlier in the month and contains direct price data for categories that markets watch closely. PCE incorporates a broader set of source data, but that breadth means the release comes later. For real-time inflation monitoring, CPI may provide the first signal, while PCE provides the policy-aligned confirmation.
These limitations do not weaken the case for using PCE in monetary policy. They define the boundaries of interpretation. PCE is the Fed’s target measure, CPI is the public-facing price index, and underlying inflation measures help separate signal from noise. Articles on economic slack and inflation prediction, sticky services inflation, and US CPI release analysis should all link back to this measurement distinction.
MASEconomics Explains
4 economic concepts behind the PCE Index
These concepts are explored in depth across our educational articles library.
Explore the MASEconomics BlogConclusion
PCE Index explained shows why the Federal Reserve’s inflation debate is centred on a broader, chain-weighted measure rather than CPI alone. The PCE price index captures a wider range of consumption, incorporates spending made on behalf of households, updates weights through chain-type methods, and anchors the Fed’s 2 percent inflation objective. CPI remains important for household cost-of-living analysis, but PCE is the main inflation measure for monetary policy because it is broader, more flexible, and integrated into the national accounts.
Frequently Asked Questions
What is the PCE Index?
The PCE Index is the Personal Consumption Expenditures price index produced by the Bureau of Economic Analysis. It measures changes in the prices of goods and services consumed by people living in the United States, including some purchases made on their behalf.
Why does the Fed prefer PCE?
The Fed prefers PCE because it has broad coverage, uses chain weighting, and is embedded in the national accounts. The Federal Reserve’s longer-run 2 percent inflation objective is defined using the annual change in the PCE price index.
How is PCE different from CPI?
PCE and CPI differ in scope, weights, and formula. CPI focuses more on out-of-pocket prices paid by urban consumers, while PCE includes a broader set of expenditures and uses chain weighting to reflect substitution across categories.
What is core PCE inflation?
Core PCE inflation is the PCE price index excluding food and energy. It is used to read the underlying inflation trend because food and energy prices often move sharply because of temporary shocks.
Is PCE better than CPI?
PCE is better for Federal Reserve policy analysis because it is broader and chain-weighted. CPI is often better for direct household cost-of-living discussions because it is closer to out-of-pocket consumer prices.
Thanks for reading! If you found this helpful, share it with friends and spread the knowledge. Happy learning with MASEconomics