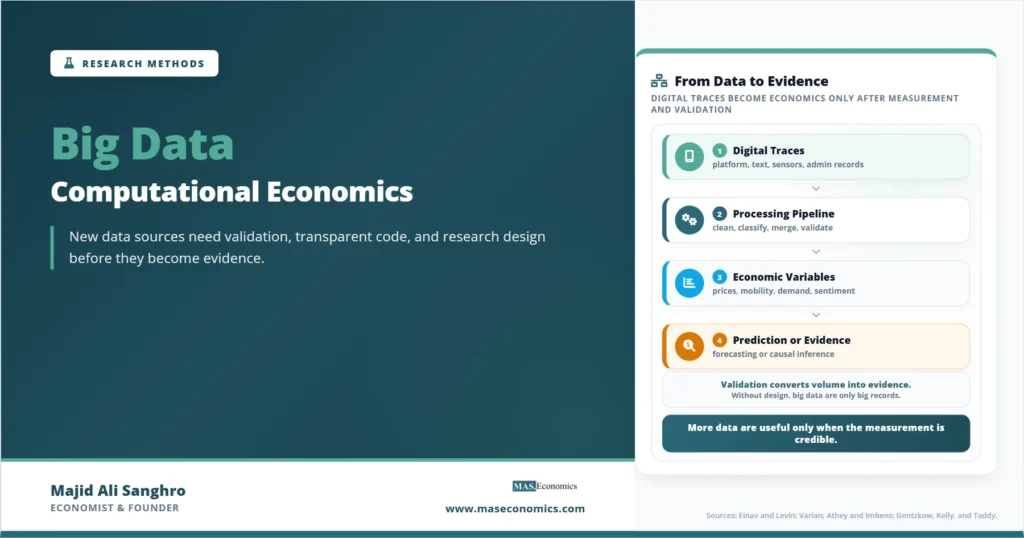
Search records, card payments, satellite images, mobile-phone traces, online prices, firm platforms, text archives, and administrative databases now record parts of economic life that older surveys could only measure slowly or incompletely. Big data computational economics uses these large, high-frequency, and often unstructured data sources with computational tools to measure behavior, predict outcomes, and study economic mechanisms.
The change is not only that datasets are larger. The deeper shift is that many datasets are now generated as a byproduct of ordinary economic activity. A consumer clicks, a delivery platform records a trip, a firm updates inventory, a satellite observes night lights, a job seeker applies online, a price changes on a website, or a government database records tax filings. These records can reveal economic behavior at a scale and speed that traditional data collection rarely matched.
For economists, that opportunity comes with a warning. More data do not automatically mean better evidence. Large datasets can be biased, incomplete, proprietary, hard to interpret, poorly documented, or disconnected from the causal question. Computational methods can find patterns, but research design still decides whether those patterns answer an economic question.
Big Data Changes Measurement First
The first contribution of big data is measurement. Economists have always studied prices, employment, consumption, mobility, credit, trade, expectations, firm behavior, and household welfare. The difference is that new digital records can measure some of these variables more frequently, more granularly, or in settings where conventional surveys are delayed or unavailable.
Einav and Levin’s “Economics in the Age of Big Data” emphasizes that the quality and quantity of data on economic activity have expanded rapidly, with empirical work increasingly using large administrative and private-sector data. Their point remains central: big data changes not only how economists estimate models, but also what questions they can ask.
Online prices can help researchers study inflation and price dispersion at high frequency. Satellite imagery can help measure economic activity, crop conditions, shipping, urban growth, or conflict effects when official data are weak. Text data can measure uncertainty, sentiment, media framing, central-bank communication, contract terms, or political narratives. Platform data can reveal search, matching, pricing, ratings, and market design in digital environments.
This connects directly to data collection in economics. Big data does not eliminate the need to ask where a variable came from, who is missing, how the record was generated, and whether the measured variable matches the economic concept. It only changes the raw material available for measurement.
Computational Methods for Big Data
Computational methods become necessary when the dataset is too large, too high-dimensional, too fast-moving, or too unstructured for manual inspection or conventional spreadsheet-style analysis. They include machine learning, natural language processing, web scraping, high-dimensional regression, clustering, classification, network analysis, simulation, distributed computing, and reproducible code pipelines.
Hal Varian’s “Big Data: New Tricks for Econometrics” explains why computer-mediated transactions create huge amounts of data and why new tools are needed to manipulate and analyze them. The important lesson for research methods is that computation is not just faster calculation. It changes the workflow of empirical economics.
A researcher using millions of online job postings cannot read every posting manually. A researcher studying central-bank speeches cannot code every sentence by hand. A researcher estimating heterogeneous treatment effects may need algorithms that search for patterns across many covariates. A researcher predicting loan default may use models that prioritize out-of-sample performance rather than simple coefficient interpretation.
Computational methods therefore sit between data engineering and economic interpretation. They help transform raw digital traces into features, variables, predictions, classifications, or estimates. But they do not decide what the economic question is. That remains the researcher’s task.
New Data Sources for Research
Big data is not one dataset type. It is a broad family of records produced by governments, firms, platforms, sensors, satellites, websites, archives, and individuals. Each source has different strengths, selection problems, privacy risks, and research uses.
| Data source | Economic information captured | Typical computational method | Main research-design risk |
|---|---|---|---|
| Administrative records | Taxes, earnings, benefits, firms, schools, health use | Record linkage, panel construction, secure computing | Access restrictions and incomplete coverage |
| Platform data | Search, matching, prices, ratings, delivery, online labor | Prediction models, experiment logs, market-design analysis | Proprietary access and platform-specific behavior |
| Web-scraped prices | Online prices, product availability, price dispersion | Scraping pipelines, classification, time-series tracking | Online prices may not represent all transactions |
| Text archives | News, speeches, filings, contracts, reviews, job ads | Natural language processing, topic models, embeddings | Words may not map cleanly to economic concepts |
| Satellite and sensor data | Night lights, land use, pollution, traffic, crop conditions | Image processing, geospatial analysis, remote sensing | Measurement proxies need validation |
| Mobile-phone and mobility data | Commuting, migration, visits, local activity, exposure | Spatial aggregation, network analysis, privacy filtering | Phone users may not represent the population |
| Financial transaction records | Spending, credit, payments, liquidity, household response | Event studies, prediction, high-frequency panels | Institution-specific customer selection |
|
Source: MASEconomics synthesis based on Einav and Levin (2014), Varian (2014), Gentzkow, Kelly, and Taddy (2019), and Athey and Imbens (2019).

|
|||
The table shows why big data must be treated as a research-methods issue, not only a technology issue. Each source changes what can be measured, but each source also changes what can go wrong. Administrative data can be accurate for covered populations but exclude informal activity. Platform data can be detailed but proprietary. Text can reveal narratives but requires careful validation. Satellite data can cover places where official statistics are weak, but it often measures proxies rather than the economic variable directly.
Prediction vs Explanation
One of the most important distinctions in computational economics is the difference between prediction and explanation. Prediction asks whether a model can forecast an outcome accurately. Explanation asks what economic mechanism produced the outcome. Causal inference asks what would happen under a different policy, treatment, or intervention.
Kleinberg, Ludwig, Mullainathan, and Obermeyer’s “Prediction Policy Problems” argues that some policy problems are fundamentally prediction problems. For example, deciding which loan applications are likely to default, which inspections are likely to find violations, or which students are at risk of dropping out may require accurate prediction before it requires causal estimation.
But prediction is not enough for every economic question. A model may predict unemployment risk accurately without explaining whether training would reduce unemployment. A credit algorithm may predict default without showing whether a lower interest rate would improve repayment. A platform model may predict demand without identifying how a price change would affect welfare.
This is why computational methods must be placed beside, not above, causal inference. Prediction helps economists allocate attention, target programs, forecast demand, or classify risk. Causal design helps economists evaluate what policy would change.
Machine Learning for High Dimensions
Machine learning is useful when the researcher faces many predictors, nonlinear relationships, interactions, or high-dimensional data. Instead of specifying every relationship by hand, the algorithm searches for patterns that improve prediction or classification.
Athey and Imbens’ “Machine Learning Methods That Economists Should Know About” distinguishes the goals of machine learning from traditional econometrics and explains why methods from the ML literature matter for empirical researchers. The key distinction is that machine learning often emphasizes out-of-sample predictive performance, while econometrics often emphasizes parameter interpretation and identification.
This distinction is essential for readers of machine learning in econometrics. A model that predicts well is not automatically a causal model. A black-box algorithm can rank households by poverty risk, but it does not automatically tell whether a cash transfer will raise long-run earnings. A model can predict firm failure, but it does not prove which policy would prevent it.
Machine learning becomes especially powerful when combined with credible research design. In causal machine learning, algorithms can help estimate heterogeneous treatment effects or control flexibly for high-dimensional confounders, but identification still depends on assumptions about assignment, selection, measurement, and overlap.
Text as Data in Economics
Text is one of the most important new data types in economics. Central-bank speeches, earnings calls, loan contracts, job postings, newspaper articles, legislative debates, product reviews, firm filings, court decisions, and social-media posts all contain information about expectations, uncertainty, sentiment, narratives, institutions, and strategic communication.
Gentzkow, Kelly, and Taddy’s “Text as Data” provides a major economics-focused overview of text methods, including the features that make text different from structured data and the statistical tools used to analyze it. Their work is important because it treats text not as decoration, but as a measurable input to economic research.
Text methods can classify job requirements, measure policy uncertainty, detect sentiment, track inflation narratives, study media slant, compare contracts, or analyze communication by firms and central banks. But text data require careful choices: tokenization, dictionaries, topic models, embeddings, training labels, language translation, document selection, and validation.
The danger is false precision. A sentiment score may look quantitative, but it depends on how language was processed. A topic model may find clusters of words, but the researcher must interpret whether those clusters correspond to economic concepts. Text becomes useful evidence only when the measurement pipeline is transparent.
Data Volume Evolution
The following visual summarizes the shift from traditional economic data toward richer computational sources. It is stylized, not real data. The purpose is to show the change in the research environment: economists increasingly combine surveys, administrative records, platform traces, text, and geospatial data.
High‑Frequency Data Signals
Many big data sources are high frequency. Online prices can update daily or hourly. Card transactions can record spending quickly. Mobility data can respond to shocks within days. Search queries can move before official statistics are released. This speed can help economists study crises, disasters, inflation, unemployment, migration, and policy responses more quickly.
But high frequency can also magnify noise. A daily series may move because of platform changes, weather, media attention, data outages, holidays, bots, or changes in user behavior. A sudden jump in online search activity may reflect concern, curiosity, panic, or media coverage, not necessarily actual economic behavior.
The research question should decide whether high frequency is valuable. If the question is immediate consumer response to a price shock, high-frequency transaction data may be useful. If the question is long-run wage mobility, annual administrative records may be better. Faster data are not automatically better data.
This is a measurement issue before it is a modeling issue. Economists must ask whether the data frequency matches the adjustment process being studied. Some economic behavior changes quickly. Other behavior changes slowly through contracts, expectations, investment, learning, and institutions.
Selection Bias in Big Data
A large dataset can be severely biased. A platform may contain millions of users but exclude people who do not use the platform. Mobile-phone data may underrepresent older, poorer, rural, or less-connected populations. Online prices may miss informal markets, offline discounts, and non-digital transactions. Administrative records may exclude informal workers or people outside the tax system.
The problem is not sample size. It is selection. If the data-generating process is selective, more observations can make a biased estimate more precise without making it more accurate. This is why big data research needs the same questions used in survey and observational research: who is included, who is missing, and why?
This connects to internal and external validity. A dataset may support a strong conclusion about behavior inside one platform but a weak conclusion about the whole economy. It may describe formal firms well but informal firms poorly. It may measure connected households well but disconnected households poorly.
Large datasets often look authoritative because of their size. Economists should resist that temptation. The credibility of evidence depends on design, not only volume.
Hidden Researcher Choices
Big data analysis often involves long pipelines. The researcher may scrape, clean, merge, de-duplicate, classify, geocode, tokenize, train, validate, estimate, and visualize before the first regression table appears. Each step contains choices.
For example, a study using job postings must decide how to identify occupations, remove duplicates, classify skills, handle missing salaries, standardize locations, and separate real openings from repeated advertisements. A study using satellite images must choose image sources, time windows, spatial resolution, cloud filters, and validation data. A text study must choose dictionaries, language models, training labels, and document inclusion rules.
These choices can affect results. They can also create room for hidden flexibility. If a researcher tries many cleaning rules or classification thresholds and reports only the most favorable result, the problem becomes similar to p-hacking. The computational pipeline becomes part of the research design.
Open code, clear documentation, and replication files are therefore essential. A computational economics paper should explain how raw records became analytical variables. Without that trail, readers may see the final result but not the decisions that produced it.
Privacy and Data Access
Many valuable big datasets are private, sensitive, or restricted. Tax records, health records, bank accounts, platform transactions, phone metadata, and firm records can expose personal or commercial information. Economists cannot treat access as a minor logistical issue.
Restricted access affects reproducibility. A paper using confidential administrative data may not be fully replicable by outside researchers. A paper using proprietary platform data may depend on a relationship with one firm. A paper using scraped data may face legal or ethical limits if terms of service or personal information are involved.
This is where open science infrastructure becomes important when the article is live and verified in your inventory. The principle is controlled transparency: share what can be shared, document what cannot, explain access restrictions, provide code where possible, and preserve enough metadata for readers to understand the workflow.
Privacy is not an obstacle to good research. It is part of good research. The credibility of computational economics depends on protecting people and firms while making the analytical path as transparent as possible.
Big Data for Policy Targeting
One of the clearest policy uses of computational methods is targeting. Governments, NGOs, lenders, schools, insurers, and platforms often need to identify which units are most likely to need support, default, drop out, evade taxes, suffer damage, or respond to an intervention. Prediction models can help allocate scarce attention.
For example, a government may use administrative and geospatial data to target disaster relief. A school system may use attendance and performance records to identify students at risk of leaving school. A tax authority may use anomaly detection to prioritize audits. A labor agency may use job-search data to identify workers who need intervention.
But targeting raises fairness and accountability questions. A model can reproduce historical bias if the training data reflect unequal enforcement, unequal access, or unequal measurement. A credit model may penalize groups with thinner formal records. A policing or tax model may concentrate scrutiny where past enforcement was already higher.
This is why prediction policy problems require institutional judgment. Accuracy is not the only policy criterion. Economists must also ask who is misclassified, what the cost of error is, whether the model can be explained, and whether the decision rule is fair and legal.
Validation in Computational Economics
Validation is the bridge between a computational output and an economic variable. A model that classifies sentiment should be checked against human labels or known events. A satellite proxy for income should be compared with survey or administrative measures. A platform measure of demand should be compared with sales, transactions, or independent benchmarks where possible.
Without validation, computational outputs can become black-box variables. A “mobility index,” “uncertainty score,” “sentiment measure,” or “economic activity proxy” may appear precise, but readers need to know what it captures and where it fails.
Validation can take several forms. Researchers can use holdout samples, out-of-sample prediction, hand-coded labels, external benchmarks, cross-dataset comparison, placebo tests, robustness checks, and sensitivity analysis. The method depends on the data source and research question.
The central rule is simple: the computational measure should be tested against something outside the model that gives it economic meaning. Otherwise, the analysis may only show patterns in data processing rather than patterns in the economy.
Big Data and Economic Theory
Large datasets can tempt researchers to start with patterns and search for explanations later. That can be useful for exploration, but economics still needs theory to interpret behavior. A model may discover that consumers who search at night buy differently, but theory helps decide whether the mechanism is income, attention, urgency, liquidity, information, or platform design.
Theory also guides what not to include. A prediction model may use thousands of variables, but a causal study must distinguish pre-treatment variables, outcomes, mediators, colliders, and selection mechanisms. A computational pipeline can generate many features, but not every feature belongs in every research design.
This connects to the scientific method in economics. Data can generate hypotheses, but hypotheses still need disciplined testing. Patterns become economic knowledge only when they are connected to mechanisms, assumptions, and evidence.
Good computational economics therefore moves between theory and data. Theory asks which mechanism might matter. Big data helps measure behavior. Computational methods help process the evidence. Research design decides what can be concluded.
Big Data and Traditional Methods
Big data complements traditional research methods rather than replacing them. Surveys can measure concepts that platforms do not record, such as expectations, perceptions, household constraints, and informal activity. Administrative data can provide long panels with high accuracy for covered populations. Experiments can identify causal effects. Text and satellite data can add measurement where conventional sources are thin.
The best empirical work often combines sources. A study of local economic activity may use administrative employment data, firm surveys, satellite night lights, and online job postings. A study of inflation expectations may use surveys, news text, search data, and central-bank communications. A study of welfare may combine household survey data with mobile mobility measures and geospatial proxies.
This mixed evidence approach reduces dependence on one imperfect source. It also creates stronger validity checks. If several independent measures move together for theoretically sensible reasons, confidence improves. If they diverge, the divergence itself may reveal measurement problems or institutional differences.
Big data is therefore not a shortcut around research methods. It increases the need for research methods because the data are richer, messier, and more mediated by institutions.
Evaluating Big Data Economics Papers
Readers should begin with the data-generating process. Who created the data? Why were the records generated? Who is included? Who is missing? Did the data exist for research, administration, commercial operations, or platform optimization? The answer affects interpretation.
The second check is variable construction. How did raw records become economic variables? Were prices cleaned? Were texts classified? Were locations geocoded? Were duplicates removed? Were outliers handled? Were model features created before or after the outcome?
The third check is validation. Does the computational measure correspond to an external benchmark? Does a prediction model perform out of sample? Does a text measure match human-coded labels? Does a satellite proxy correlate with known economic data?
The fourth check is the distinction between prediction and causation. A paper should not treat predictive accuracy as causal identification. If the claim is causal, the design must explain assignment, selection, timing, confounding, and counterfactuals.
The fifth check is transparency. Are code, metadata, documentation, and replication materials available? Are access restrictions explained? A computational paper is strongest when the pipeline can be inspected.
Explains
Four concepts behind computational economic evidence
Build stronger research judgment by learning how new data sources become credible economic evidence.
Explore the MASEconomics BlogConclusion
Big data computational economics matters because it expands what economists can measure, how quickly they can observe behavior, and which empirical questions they can ask. Administrative records, platform traces, text, satellite images, online prices, transaction data, and mobility records give researchers new ways to study economic activity.
The value of these sources depends on design. Big data can improve measurement, prediction, targeting, and policy evaluation, but it can also magnify selection bias, hide researcher choices, weaken privacy, and confuse prediction with causation. More observations do not automatically make evidence more credible.
The strongest computational economics connects new data to clear economic concepts, validates computational measures, distinguishes prediction from causal inference, documents the pipeline, and protects privacy. Big data changes the empirical frontier, but the central question remains familiar: does the evidence actually support the economic claim?
Frequently Asked Questions
What is big data in economics?
Big data in economics refers to large, high-frequency, or complex datasets, such as administrative records, platform traces, online prices, satellite images, text archives, and transaction data, used to study economic behavior.
What are computational methods in economics?
Computational methods include machine learning, text analysis, network analysis, simulation, web scraping, geospatial analysis, and reproducible code pipelines used to process complex economic data.
Does big data prove causality?
No. Big data can reveal patterns and improve prediction, but causal claims still require research design assumptions about treatment, timing, selection, confounding, and counterfactual outcomes.
Why do economists use machine learning?
Economists use machine learning to handle many predictors, nonlinear relationships, high-dimensional data, classification tasks, prediction problems, and heterogeneous treatment effects.
What is the biggest risk in big data economics?
The biggest risk is mistaking size for credibility. A very large dataset can still be biased, poorly measured, unrepresentative, proprietary, or unsuitable for the causal question.
Thanks for reading! If you found this helpful, share it with friends and spread the knowledge. Happy learning with MASEconomics