Think of the last purchase you would happily have paid more for. The gap between what you would have paid and what the till actually charged is real value, delivered to you, recorded nowhere: no receipt shows it, no national account counts it, and yet it is the reason the transaction happened at all. Consumer and producer surplus are economics’ names for this invisible value on the two sides of every market: the buyer’s gain from paying less than a good is worth to them, and the seller’s gain from receiving more than it cost to supply. The two concepts turn the familiar supply and demand diagram into a measuring instrument, they define what economists mean when they say markets create value or policies destroy it, and they answer a question that sounds naive and is actually deep: if every trade has a buyer paying and a seller charging the same amount, where does the gain from trade physically live? The answer is the two triangles, and learning to see them is learning to read welfare off a diagram.
Two Curves, Reread as Rankings
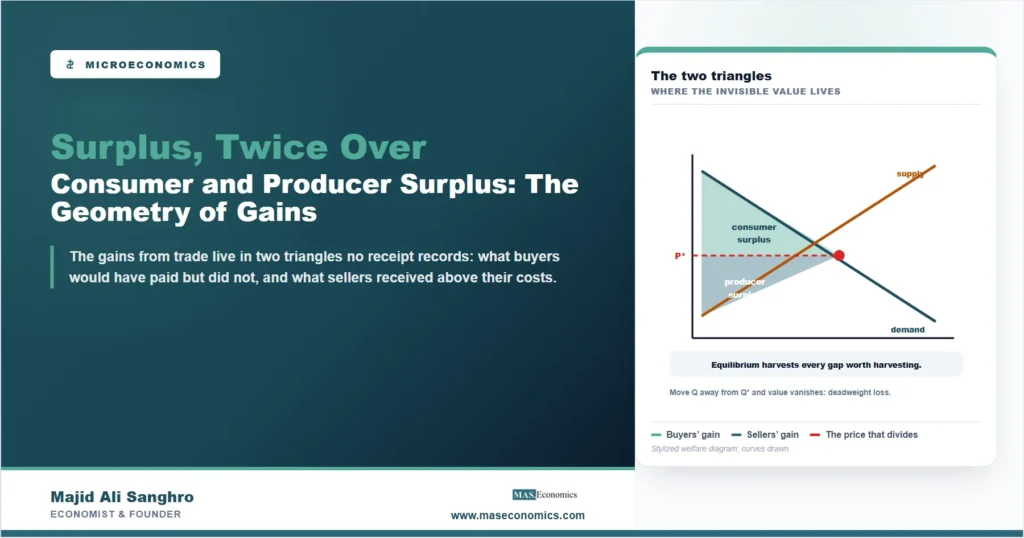
The instrument works because the curves in a market diagram carry more information than their usual price-quantity reading. Read vertically, the demand curve is a ranking of buyers by willingness to pay: its height at any quantity is the most that the marginal buyer, the one just barely in the market, would pay for that unit, so the curve descends through the eager, the interested, and the indifferent in order, a translation of the satisfaction concepts explored in our article on utility into an observable money scale. The supply curve, read the same way, is a ranking of sellers by cost: its height at any quantity is what it costs the marginal supplier to produce that unit, ascending from the low-cost producers to the strained ones. The market price, formed by the process our guide to price determination describes, then acts as a single horizontal line cutting through both rankings, and the geometry does the accounting. Every buyer whose willingness to pay sits above the price collects the difference as consumer surplus; every seller whose cost sits below it collects the difference as producer surplus; and the buyer and seller exactly at the price are the marginal pair, trading with no surplus at all, the last trade worth making.
Why Equilibrium Maximizes the Pie
The triangles convert a familiar claim into a visible one: the equilibrium quantity maximizes total surplus, the sum of the two shaded regions, and the diagram shows why with no algebra. Every unit to the left of equilibrium is worth more to some buyer than it costs some seller, so trading it adds the gap to the pie; stopping short of equilibrium leaves such gaps unharvested. Every unit to the right reverses the inequality, costing more to produce than any remaining buyer values it, so pushing output past equilibrium manufactures losses. The market price is the device that finds this edge without anyone computing it: by confronting each buyer and seller with the same number, it invites exactly the trades whose gains are positive and repels the rest. This is the precise content of the efficiency claim for competitive markets, and stating it precisely also states its limits. The maximized pie says nothing about the fairness of its division between the triangles, a split that depends on the curves’ shapes, with the steepness concepts covered in our article on price elasticity deciding whether buyers or sellers capture the larger share. And the accounting counts only the parties at the table: when a transaction burdens or benefits bystanders, the triangles mismeasure society’s true gain, the wedge between private and social value that our article on market failure and externalities takes as its subject.
Deadweight Loss, and the Surplus Nobody Counts
The instrument’s sharpest use is measuring destruction. Any policy that moves quantity away from equilibrium, a tax wedge, a price ceiling, a quota, an import tariff, prevents some trades whose gains were positive, and the value those unmade trades would have created simply vanishes: not transferred to the treasury, not captured by anyone, gone. On the diagram it is the triangle between the curves over the missing quantity, and its name, deadweight loss, is bookkeeping honesty: the part of the shrunken pie that no slice accounts for. This geometry is what disciplines policy analysis, separating transfers, surplus moved between buyers, sellers, and government, from waste, surplus destroyed, and it is applied stroke by stroke in our analysis of who pays a tariff. The same logic runs in reverse for corrective interventions: where a market’s price omits a bystander cost, the taxed outcome can enlarge true social surplus, the case drawn carefully in our article on the negative externality diagram.
A modern puzzle shows the concept’s reach beyond the classroom. Much of what people now consume daily, search, maps, encyclopedias, messaging, carries a price of zero, and a price of zero means the entire area under the demand curve is consumer surplus: enormous value, delivered every day, with almost no footprint in GDP, which records transactions rather than surplus. Attempts to measure this missing value, by asking what payment people would demand to give up such services, produce large numbers and a serious lesson: production statistics undercount an economy’s contribution to living standards wherever surplus is large relative to price, and the gap has been widening. Consumer surplus, invented as a diagram label, turns out to be a live measurement frontier.
MASEconomics Explains
3 economic concepts behind consumer and producer surplus
These concepts are explored in depth across our educational articles library.
Explore the MASEconomics BlogConclusion
Consumer and producer surplus answer the naive-sounding question of where the gains from trade live: in the gap between what buyers would have paid and did, and between what sellers received and needed, the two triangles that the market price cuts from the demand and supply rankings. The geometry earns its centrality by what it makes visible. Equilibrium’s virtue becomes a statement about harvested gaps rather than an article of faith; the division of gains becomes a question about curve shapes; and policy analysis acquires its essential distinction between moving surplus around and destroying it, with deadweight loss as the named, drawable quantity of value that vanishes when trades are prevented.
The concept’s honest limits are part of its usefulness: the triangles count only the parties at the table, weigh every dollar of surplus identically whoever holds it, and say nothing about fairness, which is why welfare analysis begins rather than ends with them. And the concept still works at the frontier, where zero-price digital services deliver surplus that production statistics cannot see, a reminder that the invisible value the triangles were invented to draw has never stopped being the point. Markets are machines for creating something no receipt records; the two triangles are how economics keeps the books on it anyway.
Frequently Asked Questions
What is consumer surplus in simple terms?
The gap between the most a buyer would have paid for something and the price actually paid. If a book is worth 30 dollars to you and costs 18, your consumer surplus is 12: real value received, recorded on no receipt. Summed across all buyers in a market, it is the triangle between the demand curve and the price line.
What is producer surplus, and is it the same as profit?
It is the gap between the price a seller receives and the cost of supplying each unit, the triangle between the price line and the supply curve. It is close to, but not identical with, profit: producer surplus nets out only the costs that vary with production, so it overstates profit by the fixed costs that would be paid regardless.
Why does the equilibrium quantity maximize total surplus?
Because to the left of equilibrium every additional unit is valued by some buyer above some seller’s cost, so trading it enlarges the pie, while to the right every unit costs more than any remaining buyer values it. Equilibrium is exactly the edge where the profitable gaps run out, and the market price finds that edge without anyone calculating it.
What destroys surplus rather than transferring it?
Anything that prevents trades whose gains were positive: taxes that wedge price apart, ceilings and floors that cap quantity, tariffs and quotas that block imports, and monopoly restriction of output. The lost value, deadweight loss, is captured by nobody, which distinguishes it from the transfers such policies also create between buyers, sellers, and government.
Is consumer surplus real money?
It is real value measured in money units, but it never changes hands, which is why no statistic based on transactions captures it. The point has grown in importance: zero-price digital services deliver enormous consumer surplus with almost no GDP footprint, so production statistics increasingly understate what consumption contributes to living standards.
Thanks for reading! Markets create value no receipt records, and the two triangles are how economics keeps the books on it anyway. Happy learning with MASEconomics