A working paper in economics runs to fifty pages, and perhaps four of them decide whether the finding is true. The rest is setup, related literature, robustness and appendix. Anyone who reads such a paper the way they would read a book, front to back at a constant pace, spends most of their attention on the parts that carry the least weight and arrives at the conclusion with no independent view of whether to believe it. Knowing how to read an economics paper means knowing which four pages those are, in what order to visit them, and what question each one has to answer before the next is worth reading. This article sets out that order, the checks that belong at each stage, and the small number of things that most often turn out to be wrong.
Read for the Claim, Not the Topic
Start by extracting one sentence: what does this paper claim causes what, for whom, and by how much. Not the subject, which is what the title gives, but the claim. “The effect of minimum wages on employment” is a topic; “a ten percent minimum wage increase reduced teenage employment in these counties by about one percent over two years” is a claim. If a paper cannot be reduced to a sentence of that shape after reading the abstract and the last paragraph of the introduction, that is itself informative, and usually means the contribution is a method or a dataset rather than a finding.
The claim tells you what standard of evidence applies. A causal claim requires a comparison that isolates one moving part, and the whole apparatus described in our guide to causal inference exists to construct it. A descriptive claim requires only that the data measure what it says, which is a lower bar and often a more useful contribution than a weak causal estimate. A forecasting claim needs out-of-sample performance and nothing else. Papers get into trouble when the abstract makes a causal claim and the design supports a descriptive one, and that mismatch is visible in the first five minutes if you are looking for it. Our article on correlation and causation is the general version of this check, and the practice of writing the claim down before reading further is the reverse of the discipline our piece on framing a research question asks of an author.
The Order That Works
The productive order is not the printed one. Read the abstract, then go to the main results table, then to the identification section, then to the robustness checks, and only then to the introduction and conclusion in full. The reason is that the tables are the paper. The prose describes them, and the prose is written by someone who wants the result to be believed, so reading it first installs an interpretation before you have seen what it is an interpretation of.
At the main results table, three things matter before any interpretation. The units: an estimate is meaningless until you know whether it is in log points, percentage points, standard deviations or dollars, and whether the comparison is to a mean you can find in the summary statistics. The magnitude relative to something real: a coefficient that is statistically distinguishable from zero can still be too small to matter, and converting it into the outcome’s own scale is the fastest way to see that. And the sample: how many observations, at what level, and how many clusters, since standard errors clustered on a handful of groups are far less reliable than the count of observations suggests.
Identification Is the Section That Decides
Every credible empirical paper in economics answers one question at its centre: compared with what? The estimate is a difference between what happened and what would have happened otherwise, and since the second is never observed, the paper has to construct a stand-in. The identification section is where that construction is explained, and it is the part most worth reading slowly, because everything downstream inherits whatever it gets wrong.
What to look for depends on the design, and the site covers each in its own article. In a difference-in-differences paper, the assumption is that treated and untreated groups would have moved in parallel without the treatment, so look for the pre-trend evidence and check whether the treatment was staggered across units, which is the case our article on modern difference-in-differences estimators shows the classic estimator handles badly. In an instrumental variables paper, ask what makes the instrument affect the outcome only through the variable of interest, an assumption that cannot be tested and must be argued, and check the first-stage strength, since a weak instrument is worse than none, as our explainer on instrumental variables sets out. In a regression discontinuity paper, the question is whether units just above and just below the cutoff are otherwise comparable and whether anyone can manipulate their position, the checks described in regression discontinuity design. In a matching paper, ask what is being matched on and what plainly cannot be, the limit our article on propensity score matching is careful about. And where the design is a natural experiment, the whole argument rests on whether the event was really unrelated to the outcome, which our piece on natural experiments examines.
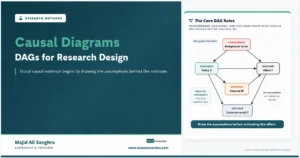
A useful discipline, borrowed from the graphical tradition our article on causal diagrams describes, is to sketch the paper’s assumed structure yourself in the margin: the treatment, the outcome, the confounders the author controls for, and the one the design is supposed to neutralise. If you cannot draw it, the paper has not explained it, and that is a finding about the paper rather than about you.
Read the Robustness Table for What Is Not There
Robustness sections are written to reassure, and they usually succeed, because a table of fifteen specifications that all produce the same sign is genuinely persuasive. The question worth asking is different: which specification would have overturned the result, and is it here? A paper that varies the control set, the winsorising threshold and the standard error method, but never drops the one region that supplies half the identifying variation, has tested the things that were never going to matter.
Three specific absences are worth noticing. The first is the sample restriction that is stated once in the data section and never revisited, since a result that exists only among a subsample chosen after seeing the data is the pattern our article on p-hacking describes. The second is the outcome that was measured but not reported: if a survey collected five outcomes and the paper reports one, the other four are informative, which is why pre-registration exists and why a pre-analysis plan makes a paper much easier to trust. The third is statistical power, since a result that is barely significant in a small sample is very likely to be an overestimate even when it is real, the point our explainer on power analysis develops. None of these makes a paper wrong. They tell you how much weight it can carry.
| Pass | What to check | The failure it catches |
|---|---|---|
| Abstract | Reduce it to one claim: what causes what, for whom, by how much | A causal claim resting on a descriptive design |
| Main table | Units, magnitude against the outcome mean, observations and clusters | Statistical significance mistaken for economic importance |
| Identification | The counterfactual: what varies, and why it is as good as random | A comparison that never isolated the treatment |
| Robustness | The specification that would have overturned it, and whether it appears | Specification search dressed as thoroughness |
| Data section | Sample restrictions, attrition, and outcomes measured but not reported | A result that survives only on a chosen subsample |
| External validity | The population, period and setting the estimate belongs to | A local estimate quoted as a general law |

|
||
What the Paper Is Evidence For
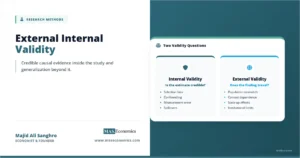
The last step is to decide what the finding covers, which is almost never what the title implies. An estimate belongs to a population, a period and a setting: these firms, in this country, under this policy regime, in these years. Whether it travels is a separate question that the paper usually cannot answer, and our article on internal and external validity is about exactly that gap. Instrumental variables estimates carry a further restriction that is easy to miss: they identify the effect for the units whose behaviour the instrument actually changed, which may be a small and unrepresentative slice of the sample.
Then place the paper against its literature rather than reading it alone. A single result is weak evidence however clean it is, and the reason is structural: findings that reject the null are more likely to be published, so any one paper is drawn from a skewed pile, the mechanism our article on publication bias describes and the reason the replication crisis was a surprise to almost nobody who had thought about it. The honest question is not whether this paper is convincing but whether the literature it sits in points the same way, which is what a meta-analysis tries to establish and what a systematic literature review organises. Where the authors have posted replication files, the strongest reading of all is available: run the code, change one choice, and see what moves.
MASEconomics Explains
3 concepts behind reading a paper critically
These concepts are explored in depth across our educational articles library.
Conclusion
Learning how to read an economics paper is mostly learning what to read first. Reduce the abstract to a single claim about what causes what and by how much, go to the main table and establish the units and the magnitude before any interpretation, then spend the largest share of the time on identification, because the counterfactual is where a paper is made or lost. Read the robustness section for the check that is missing rather than the fifteen that are present, and leave the introduction and conclusion until last, when their framing can be judged against evidence you have already seen.
The reward is not speed, though it is faster. It is that the reading produces a view of your own: what this paper establishes, for whom, and how much weight it can carry in an argument. A paper that survives all five passes is worth citing with confidence. One that fails at identification is worth reading for its data and its question, which is a real contribution and a different one. Most papers fall somewhere between, and being able to say precisely where is the whole skill.
Frequently Asked Questions
In what order should an economics paper be read?
Abstract, then the main results table, then the identification section, then the robustness checks, and the introduction and conclusion last. The tables carry the evidence and the prose carries the interpretation, so reading the prose first installs a reading of results you have not yet seen. Any of the first four passes can end the reading.
What is an identification strategy?
The argument for why the comparison in the paper isolates the effect of the variable of interest: what varies across units or time, what is held fixed, and why that variation can be treated as if it were randomly assigned. It is an argument supported by evidence rather than a test with a p-value, and everything estimated downstream inherits its weaknesses.
How long should it take to read an economics paper?
About an hour for a paper worth believing, and far less for most. Two minutes on the abstract and ten on the main table settle a large share of papers, because the claim is unclear, the magnitude is trivial once converted into the outcome’s own units, or the design cannot support the claim being made. Time is best spent on identification, which deserves twenty minutes on its own.
What should be checked in a robustness section?
Which specification would have overturned the result, and whether it is shown. Varying control sets and standard error methods is routine and rarely decisive. The informative checks are dropping the subsample that supplies most of the identifying variation, reporting the outcomes that were measured but not headlined, and showing that the result does not depend on a sample restriction chosen after seeing the data.
Does a statistically significant result mean the effect matters?
No. Significance says the estimate is distinguishable from zero given the sample; it says nothing about size. Convert the coefficient into the outcome’s own units and compare it with the outcome mean. In a large sample, an effect too small to influence any decision can be highly significant, and in a small sample, a barely significant estimate is likely to overstate the true effect even when the effect is real.
Why is a single paper weak evidence even when it is well done?
Because published findings are a selected sample. Results that reject the null are more likely to be written up and accepted, so any individual paper is drawn from a skewed pile, and its estimate is more likely to sit at the large end of the distribution of true effects. The stronger question is whether the literature as a whole points the same way, which is what systematic reviews and meta-analyses exist to answer.
Thanks for reading! Read the tables before the prose, and the paper will tell you what it found instead of what it wants you to think it found. Happy learning with MASEconomics