When the Federal Reserve held its policy rate at zero between 2008 and 2015, many commentators described monetary policy as “extremely accommodative”. When the same rate sat near 5.5 percent in 2024, the same commentators described policy as “restrictive”. But “accommodative” and “restrictive” are relative terms. They are relative to a benchmark rate at which monetary policy is neither pushing the economy toward expansion nor pulling it toward contraction. That benchmark is the neutral rate of interest, or r-star, and almost everything central banks say about policy stance depends on where r-star sits. The unusual feature of the neutral rate of interest r-star is that it is unobservable. It cannot be read from any data series, it has to be estimated from models, and the estimates have moved by 200 basis points or more over the last twenty-five years. Policy stance is therefore measured against a moving target whose location no one can verify in real time.
The concept of r‑star originates with Knut Wicksell’s 1898 work on the natural rate of interest, which sat dormant for most of the twentieth century before returning to the centre of policy discussion in the 2000s. The canonical Laubach‑Williams and Holston‑Laubach‑Williams models estimate r‑star using a Kalman filter, and the range of published estimates remains wide enough to change the interpretation of the current policy stance. The question of whether r‑star has begun to rise from its post‑2008 lows is one of the most contested empirical issues in central banking.
Wicksell’s Original Insight
The Swedish economist Knut Wicksell, writing in Interest and Prices in 1898, defined what he called the natural rate of interest as the rate that would equate desired saving and desired investment at full employment, and at which the price level would remain stable. If the rate set by banks fell below the natural rate, businesses would borrow more than savers were willing to lend at that rate, demand would exceed supply, and prices would rise. If the bank rate sat above the natural rate, the opposite would happen, and prices would fall. Wicksell’s framework was developed before central banks formally targeted interest rates and before the term “monetary policy” existed in its modern sense, but the underlying logic survives intact more than a century later.
The modern term r-star refers to the same concept restated in real terms: the real short-term interest rate that, in equilibrium, would close the output gap and keep inflation at target with no other shocks. The asterisk indicates the equilibrium or “star” value, by analogy with the Friedman natural rate of unemployment u-star, which is a separate concept covered in the literature on the Friedman-Phelps natural rate hypothesis. The two stars share only the structural language of equilibrium. Their economy is distinct.
The crucial implication of the Wicksellian framework is that monetary policy stance is not measured by the level of the policy rate alone. It is measured by the gap between the actual real rate and r-star. A 5 percent nominal rate with 3 percent inflation is a 2 percent real rate. If r-star is 1 percent, that policy is restrictive by 100 basis points. If r-star is 3 percent, the same policy is accommodative by 100 basis points. The same number on the screen can mean opposite things depending on a benchmark that no one observes directly.
Monetary Policy Stance
The Post‑1980s Decline in r‑star
For most of the twentieth century, r-star was treated as a slow-moving parameter that could be approximated by the long-run average real interest rate. In the United States, the average sat around 2.5 to 3 percent for the postwar decades. By the late 1990s, evidence began accumulating that this average was no longer descriptive. Real interest rates were falling globally even when policy was clearly tight by other measures. The fall continued through the 2000s and accelerated after the global financial crisis. By the early 2020s, most central-bank-style estimates of r-star for advanced economies sat below 1 percent in real terms, a regime change from the postwar baseline of more than 200 basis points.
Three structural drivers are most commonly cited for the decline. The first is demographics. Aging populations save more during their working years and dissave less aggressively in retirement than earlier generations did, producing a global saving glut that pushes r-star down. Work by the Bank for International Settlements has traced the relationship between dependency ratios and equilibrium rates across advanced economies. The second is productivity growth, which has slowed across most advanced economies since the early 2000s. Lower trend growth lowers the marginal product of capital, which lowers the equilibrium return on investment that savings must accept to clear the loanable funds market. The third is rising demand for safe assets, particularly US Treasuries, driven by reserve accumulation in emerging markets and regulatory demand from banks and pension funds. Strong demand for safe assets pushes their yields down, which translates into a lower r-star benchmark.
None of these drivers can be dismissed as cyclical. Demographics shift slowly and predictably. Productivity growth has stayed weak across multiple business cycles. Safe-asset demand has been remarkably persistent through three decades of changing financial conditions. The structural interpretation matters because it implies that r-star will not revert to its 1990s level even when policy normalizes. Central banks setting policy in 2025 cannot use a 1990s benchmark to judge whether their stance is tight or easy.
Estimating r‑star: The Laubach‑Williams Framework
Because r-star is unobservable, it must be inferred from data series that are themselves noisy and that respond to the same unobservable variable. The canonical solution is a Kalman filter applied to a small structural model of the economy. The framework was developed by Thomas Laubach and John Williams in their 2003 paper, “Measuring the Natural Rate of Interest”, published in the Review of Economics and Statistics. Williams later served as president of the Federal Reserve Bank of New York, where versions of the model continue to inform Fed analysis. A multi-country extension by Holston, Laubach, and Williams in 2017, often abbreviated HLW, extends the framework to the United States, the euro area, Canada, and the United Kingdom.
The model represents the economy with three core equations. The first is an IS-curve linking the output gap to lagged output gaps and the deviation of the real rate from r-star. The second is a Phillips curve linking inflation to the output gap. The third is a stochastic process for r-star itself, modeled as a function of trend growth and a slow-moving unobserved component capturing the other structural drivers. The Kalman filter then extracts r-star from observed inflation, output, and real interest rate data subject to the constraint that the model fits the data optimally.
Holston-Laubach-Williams Core Equations
The framework has clear advantages. It uses minimal data, runs in real time, and produces internally consistent estimates of r-star, trend growth, and the output gap simultaneously. It has also become the de facto reference point for central bank discussion of equilibrium rates, with the Federal Reserve Bank of New York publishing updated HLW estimates each quarter.
The framework also has limits. It is heavily model-dependent, and small changes in the assumed structure produce large changes in the estimated r-star. End-of-sample estimates are particularly unstable because the filter has no future observations to use for refinement. The 2020-2021 pandemic episode pushed many of these models into territory where their structural assumptions are uncertain to hold, and several central banks suspended publication of their own estimates during this period.
Current Estimates and the Range of Disagreement
The range of published r-star estimates as of mid-2025 reflects both genuine analytical disagreement and the structural difficulty of estimating an unobservable variable from limited data. The HLW model produces US r-star estimates in the range of 0.7 to 1.2 percent. The Lubik-Matthes model from the Federal Reserve Bank of Richmond produces estimates closer to 2 percent. Survey-based measures, such as the FOMC’s own Summary of Economic Projections, place the longer-run real federal funds rate around 0.9 to 1.1 percent. Bond market-based measures derived from five-year-forward five-year real Treasury yields produced estimates above 2 percent in mid-2025, well above most model-based numbers.
| Estimate Source | Method | Mid-2025 r-star (real, %) | Key Strength |
|---|---|---|---|
| HLW (NY Fed) | Kalman filter, structural model | 0.7 to 1.2 | Canonical reference, real-time updates |
| Lubik-Matthes (Richmond Fed) | Time-varying VAR | 1.8 to 2.2 | Less restrictive structural assumptions |
| FOMC Longer-Run SEP Median | Survey of FOMC participants | 0.9 to 1.1 | Direct policymaker views |
| 5y5y Forward Real Treasury | TIPS-derived market expectation | 2.0 to 2.4 | Market-implied, no model dependence |
| Range | Model and market combined | 0.7 to 2.4 | Span of 170 basis points |
|
Sources: Federal Reserve Bank of New York HLW updates, Federal Reserve Bank of Richmond Lubik-Matthes series, FOMC Summary of Economic Projections, US Treasury TIPS yields.

|
|||
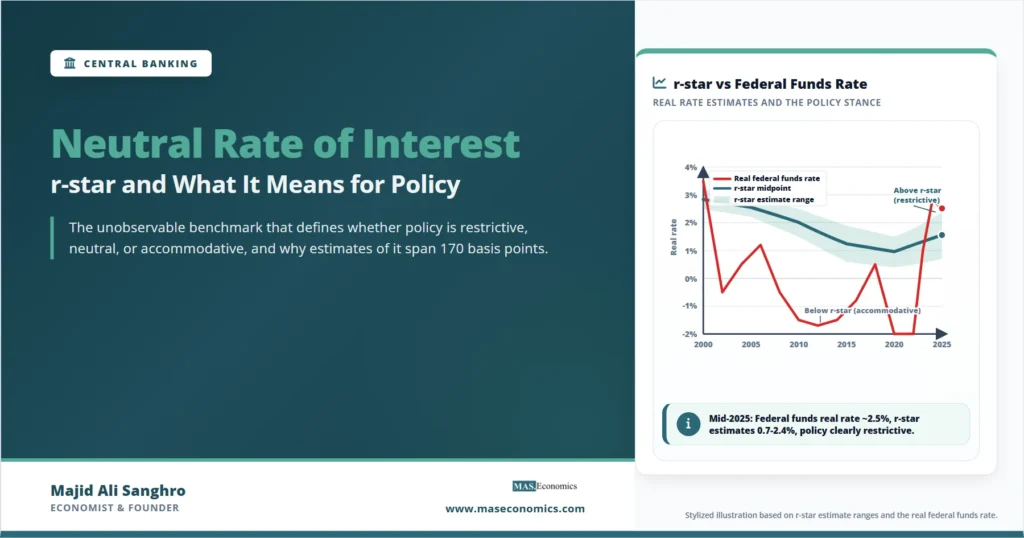
A span of 170 basis points between the lowest and highest credible estimates is the central problem of using r-star in real-time policy. The FOMC must decide whether a 5 percent nominal policy rate with 2 percent inflation, implying a 3 percent real rate, is 80 basis points above neutral (using the high end of the range) or 230 basis points above neutral (using the low end). The answer dictates how much further policy must move, when cutting should begin, and how aggressive the cuts should be. Different FOMC participants demonstrably weight different estimates differently, which is part of why the SEP dot plot can display a span of 100 basis points or more across committee members at any given meeting.
Three patterns emerge from the chart. First, the real federal funds rate has been below r-star for most of the post-2008 period, consistent with monetary policy being accommodative or near-neutral for roughly fifteen years. Second, the central estimate of r-star has trended down across the entire sample, with the largest drop in the post-2008 decade. Third, the period since 2023 represents the first sustained episode in two decades where the real federal funds rate has been above even the upper end of the r-star range, which is the technical basis for describing recent policy as genuinely restrictive.
The width of the r-star band in the chart is not a confidence interval in the statistical sense. It is the dispersion across credible model-based and market-based estimates. The genuine statistical uncertainty around any single estimate is wider still, often exceeding 100 basis points at one-standard-deviation. Real-time policy decisions are made against a benchmark with substantial uncertainty in both its level and its rate of change.
r‑star and Policy Rules
The Taylor rule and its descendants explicitly anchor recommended policy rates to r-star. The Taylor 1993 specification proposes a nominal policy rate equal to r-star plus current inflation plus weighted gaps in inflation from target and output from potential. The rule produces a coherent reaction function for short-run policy, but only if r-star is known. When r-star moves from 2.5 percent to 0.5 percent without being recognized in real time, the rule prescribes nominal rates that are systematically too high, biasing policy toward unintended restriction.
This was a recurring theme in the assessment of Fed policy during the 2010s. Several retrospective analyses, including work by Williams himself and by Olivier Blanchard, argued that the FOMC’s normalization plans between 2014 and 2018 implicitly assumed an r-star around 2 percent that turned out to be closer to 1 percent. The result was that even slow, gradual increases in the policy rate produced more restrictive financial conditions than the FOMC intended. Real-time downward revisions to r-star caused the FOMC to recalibrate, including the December 2018 pause and the subsequent 2019 rate cuts.
The reverse pattern emerged in the post-pandemic tightening cycle. With r-star possibly rising due to fiscal expansion, defense spending, and reshoring, some FOMC participants began to argue that the natural rate had moved higher and that the policy rate needed to stay elevated for longer to maintain the same restrictive stance. The debate over whether r-star has moved up since 2020, and by how much, is one of the most contested empirical questions in central banking as of 2025. The answer affects how long the federal funds rate must remain above 4 percent before policy can plausibly be described as neutral, and it affects similar calibrations in the European Central Bank and the Bank of England.
The Effective Lower Bound and Low r‑star
A low r-star creates an additional policy problem that did not exist when the equilibrium rate was 2.5 to 3 percent. Central banks set nominal rates, and nominal rates cannot fall meaningfully below zero without invoking negative-rate policies that several central banks have used but that carry recognized side effects. The conventional rule of thumb is that the Federal Reserve needs about 500 basis points of room to cut rates in a typical recession. If r-star is 1 percent and the inflation target is 2 percent, the nominal policy rate at equilibrium is only 3 percent. A 500-basis-point cut would push the policy rate to negative 2 percent, well below the effective lower bound that the Fed has historically observed.
This logic was the central motivation for the Federal Reserve’s 2020 framework review, which produced the shift to average inflation targeting and the willingness to tolerate inflation above 2 percent for periods following undershoots. A higher average inflation rate raises nominal rates at equilibrium by the same amount, which restores some room to cut without hitting the lower bound. The same logic underlies similar framework discussions at the Federal Reserve, the European Central Bank, and the Bank of Canada. A low r-star is the structural reason these debates exist.
The consequence in episodes of severe recession is the liquidity trap, where conventional interest-rate policy loses traction at the lower bound and central banks must rely on quantitative easing, forward guidance, and other unconventional tools. Japan has been living with this terrain since the late 1990s. The euro area entered similar territory after 2014. The United States approached the bound in 2009-2015 and again in 2020-2022. Whether all advanced economies will be at the bound more frequently in the coming decades depends largely on whether r-star stays low.
Limits of the r-star Concept
R-star is the standard benchmark in modern central banking, but its limits are worth pulling out for honest analysis.
The first limit is the unobservability problem itself. The HLW filter and similar tools produce point estimates with wide confidence intervals, and the estimates revise materially as new data arrives. The 2020-2021 estimates were heavily affected by the pandemic, which pushed both inflation and output away from their structural paths in ways the model could not cleanly attribute. The most recent vintages of HLW estimates are noticeably less stable than earlier vintages, which is a property of the underlying methodology rather than a problem with the data.
The second limit is that r-star is a long-run concept, but policy operates in the short run. The neutral rate that would clear markets in a steady state may be 1 percent, while the equilibrium real rate for the next two years given the current stock of debt, the current path of fiscal policy, and the current state of business investment, could be considerably different. Several recent analyses have proposed distinguishing between a long-run r-star and a “short-run neutral rate” that is more relevant for immediate policy decisions. This distinction is now standard in Bank of England commentary and is appearing in FOMC discussion.
The third limit is the joint determination problem. Fiscal policy affects r-star through public debt dynamics. A persistent rise in public debt can push the equilibrium real rate up, which means that monetary policy operates with a moving target whose movement is partly the result of choices being made by other policymakers. The interplay between monetary and fiscal anchors is the subject of the broader literature on fiscal and monetary policy, and the determination of r-star sits inside it rather than above it.
The fourth limit is the inflation target dependence. R-star is typically defined assuming the central bank’s inflation target is met. If the target itself moves, the nominal equilibrium rate moves with it, even if the real r-star is unchanged. The shift to average inflation targeting and the broader framework revisions across major central banks since 2020 are not just changes in how the target is met. They are changes in what the target is, and they change the policy rate that corresponds to a given r-star.
Explains
Three concepts behind the neutral rate of interest
From r-star to the Taylor rule, average inflation targeting, and the broader toolkit of modern monetary policy.
Explore the MASEconomics BlogConclusion
The neutral rate of interest r-star is the central anchoring concept in modern monetary policy, but it is also the most slippery one. It defines whether a given policy rate is restrictive, accommodative, or neutral, but it cannot be observed directly and the estimates that exist span a range wide enough to materially change how central banks frame their own decisions. The structural decline of r-star over the past three decades is one of the most important developments in macroeconomics, both because it has reshaped policy frameworks and because it has made the lower bound a more frequent practical constraint than it had been at any earlier point in the postwar era.
The Wicksellian framework that gave the world this concept in 1898 still holds. Monetary policy stance is the gap between the real rate the central bank sets and the real rate at which the economy clears. The empirical challenge of estimating that second rate is what makes r-star a research question rather than a published statistic. Central banks have learned to communicate around the uncertainty by referring to ranges, citing multiple model vintages, and treating the FOMC’s longer-run real-rate dot in the SEP as a survey rather than a forecast. The next decade of central banking will be shaped by whether r-star has begun to rise again from its 2010s lows, and by how quickly central banks can identify any genuine change against the noise of normal estimation revisions. The honest assessment is that no one knows yet.
Frequently Asked Questions
What is the neutral rate of interest, or r-star?
R-star is the real short-term interest rate consistent with the economy operating at full employment and stable inflation in the absence of new shocks. It is the benchmark against which the actual real policy rate is compared to judge whether monetary policy is restrictive, neutral, or accommodative. The concept originates with Knut Wicksell’s 1898 work on natural rates of interest.
Why can r-star not be measured directly?
Because it is defined as an equilibrium concept that requires the economy to be at full employment with inflation at target and with no shocks present. Real economies almost never satisfy all of those conditions simultaneously. R-star must therefore be estimated from a model that infers what the real rate would be in that hypothetical state, using the observable behavior of inflation, output, and interest rates as inputs.
Why has r-star declined since the 1990s?
The most cited drivers are demographics, with aging populations pushing global savings up; slower productivity growth, which lowers the marginal product of capital; and rising demand for safe assets from emerging-market reserves and pension funds. None of these drivers is purely cyclical, which implies that r-star is unlikely to revert to its postwar baseline even after the current policy cycle normalizes.
How do central banks use r-star in policy decisions?
R-star anchors policy rules like the Taylor rule, which prescribe a nominal rate equal to r-star plus inflation plus weighted gaps. It also informs internal discussion of where policy needs to sit to achieve a given degree of restriction or accommodation. The FOMC publishes its members’ longer-run real federal funds rate views in the Summary of Economic Projections, which is one of the most-watched indicators of where committee members place r-star.
Is r-star the same as the natural rate of unemployment?
No. The natural rate of interest, r-star, and the natural rate of unemployment, often called u-star, are distinct concepts. R-star refers to the equilibrium real interest rate. U-star refers to the equilibrium unemployment rate consistent with stable inflation. Both share the equilibrium asterisk notation but they are estimated separately and refer to different parts of the macroeconomic system.
Has r-star started rising again since 2022?
This is one of the most contested empirical questions in central banking as of 2025. Some estimates, particularly market-based measures from TIPS yields, suggest r-star has risen 50 to 100 basis points since 2020. Model-based estimates from HLW and similar frameworks show smaller increases. Drivers cited for a possible rise include sustained fiscal expansion, defense and energy investment, and reshoring of supply chains. The signal-to-noise ratio in current data is not yet high enough to settle the question.
Thanks for reading! If you found this helpful, share it with friends and spread the knowledge. Happy learning with MASEconomics