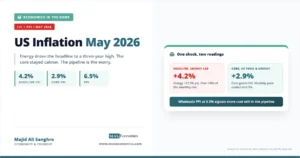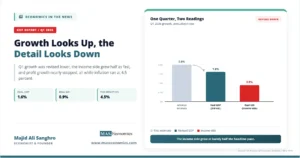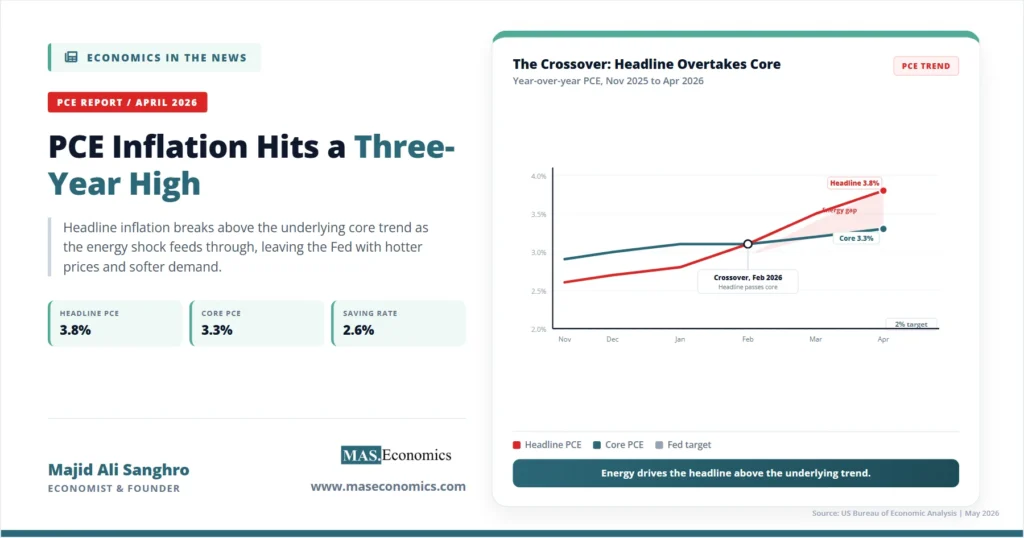
The Federal Reserve’s preferred inflation gauge climbed to its highest level in three years just as the central bank’s room to respond narrowed to almost nothing. The US PCE inflation April 2026 report, released by the Bureau of Economic Analysis on May 28, showed the headline personal consumption expenditures price index up 3.8 percent from a year earlier, the steepest annual reading since May 2023. On the same morning, the BEA revised first-quarter GDP growth down to 1.6 percent. Inflation near 4 percent and growth below 2 percent is the combination the Fed has tried hardest to avoid, and it now sits squarely in the data.
For American households, the report told a sharper story than the percentages suggest. Personal income was flat in April, the personal saving rate fell to 2.6 percent, and real spending barely moved. Families are covering higher prices by saving less rather than earning more. For the United States and its major trading partners, the release matters because it sets the backdrop for the June 16–17 meeting of the Federal Open Market Committee, the first full policy cycle under new Chair Kevin Warsh, and because a Fed that cannot cut without risking inflation is a Fed whose decisions ripple through the dollar, global borrowing costs, and every economy that prices trade in dollars.
April PCE Report Key Figures
The personal consumption expenditures price index is the measure the Federal Reserve targets when it says it wants inflation at 2 percent. It is broader than the consumer price index and updates its spending weights more frequently, which is one reason policymakers prefer it. The April figures broke down as follows.
Headline PCE rose 0.5 percent on the month and 3.8 percent over the year. The annual figure accelerated from 3.5 percent in March, and the monthly pace, while slightly below what forecasters expected, was still strong enough to keep the twelve-month rate rising. The increase was concentrated in energy. Goods prices, which had been falling for much of the prior year, were up 1.2 percent from a year earlier as the oil shock from the Strait of Hormuz worked its way through fuel, transport, and the cost of moving everything else.
Core PCE, which strips out food and energy to show the underlying trend, rose 0.2 percent on the month and 3.3 percent over the year, up from 3.2 percent in March. The gap between headline and core is the analytically important part of this release. A headline number driven by energy can reverse quickly if oil prices fall back. A core number that keeps drifting higher signals that the price pressure is spreading into services, rents, and wages, where it becomes far harder to remove. In April, headline ran hot because of energy, but core also edged up, and that combination is what kept the report from being dismissed as a one-off energy spike. The distinction between the two is the same one we examine in why the Fed looks through food and energy, and it is doing heavy lifting in the current debate.
| Measure | Monthly change | Annual change | March annual |
|---|---|---|---|
| Headline PCE price index | +0.5% | +3.8% | +3.5% |
| Core PCE (ex food and energy) | +0.2% | +3.3% | +3.2% |
| Goods prices | −0.1% | +1.2% | — |
| Personal income | <0.1% | — | +0.6% |
| Personal saving rate | 2.6% | — | 3.6% |
|
Source: U.S. Bureau of Economic Analysis, Personal Income and Outlays, April 2026 (released May 28, 2026).

|
|||
Energy Driving the Headline
The proximate cause of April’s acceleration is the energy channel opened by the conflict around the Strait of Hormuz. When a chokepoint that carries roughly a fifth of the world’s seaborne oil comes under threat, the price of crude rises, and the increase passes quickly into the prices households see at the pump and in their utility bills. We traced how that single chokepoint reshaped global prices in our analysis of the 40-kilometer chokepoint and the wider Iran oil shock of 2026. The April PCE report is, in large part, the domestic price record of that shock.
Energy shocks have a characteristic shape. They hit headline inflation fast, because fuel is a frequent purchase with visible prices, and they fade if the underlying disruption resolves. The risk for the Federal Reserve is not the first-round effect, which it can look through, but the second-round effect, in which higher fuel costs feed into transport, production, and eventually wage demands as workers seek to protect their real incomes. April’s data does not yet show that wider pass-through is complete, but the uptick in core PCE is the first place it would appear. This is why the same energy increase can be read two ways, and why the Fed is reluctant to commit to either reading until more months of data arrive.
Household Squeeze: Saving Less, Spending Same
The most revealing numbers in the April release were not the price indices but the income and saving figures. Personal income was essentially unchanged on the month, disposable income fell slightly, and personal consumption still rose 0.5 percent in nominal terms. The arithmetic only closes one way. Households drew down savings to keep spending. The personal saving rate fell to 2.6 percent, among the lowest readings in years, and once spending is adjusted for inflation, the real increase was marginal.
This is the difference between a nominal figure and a real one, and it is where the headline growth in consumer spending becomes misleading. A 0.5 percent rise in spending sounds like strength. After accounting for prices that rose almost as fast, it reflects households running to stand still. The distinction between nominal and real values, which we set out in real wages, real GDP, and real interest rates, is exactly what separates a consumer who is getting richer from one who is merely paying more. A saving rate this low also leaves households with a thinner cushion against any further shock, which is a vulnerability the Fed weighs when it considers how much restraint the economy can absorb.
Note. PCE inflation and CPI inflation usually differ by a few tenths of a percentage point. PCE uses broader coverage and updates spending weights more often, and it is the index named in the Federal Reserve’s 2 percent target. CPI tends to run slightly higher, which is one reason the headline numbers reported for the two indices in the same month are not identical.
The Box the Fed Is In
The Federal Reserve operates under a dual mandate: stable prices and maximum employment. For most of the past two years, those goals pointed in the same direction, because cooling inflation allowed the Fed to ease without abandoning price stability. The April data pulls them apart. Inflation near 4 percent argues for keeping policy tight or even tightening. A first-quarter growth rate revised down to 1.6 percent, alongside a softening labor market, argues for cutting. The Fed cannot fully satisfy both at once, and that conflict is the defining feature of the current moment.
This is the textbook setup for stagflation, the uncomfortable mix of high inflation and weak growth that we examine when inflation and recession hit together. The comparison to the 1970s has returned to mainstream commentary, and it deserves to be taken seriously, with one important qualification. In the 1970s, longer-term inflation expectations became unanchored, embedding higher inflation into wage and price setting. So far in 2026, survey-based long-run expectations have stayed close to the Fed’s 2 percent target. That anchor is the single most important thing standing between an energy shock and a self-reinforcing inflation spiral, and protecting it is the central reason the Fed has resisted cutting despite the weaker growth picture.
Complicating the decision further is the lag between policy and effect. A rate change today does not reach inflation or employment for many months, which means the Fed is always acting on a forecast rather than on the data in front of it. We set out why this timing problem is so hard in why central banks struggle to time inflation responses. Faced with an energy shock of uncertain duration and a growth slowdown of uncertain depth, the Committee’s caution is a rational response to genuinely two-sided risk, not indecision.
How April PCE Fits the CPI Already Reported
The PCE release does not arrive in isolation. Earlier in May, the consumer price index for April had already shown inflation reaccelerating, with the energy component carrying much of the increase and services inflation proving sticky. We covered that report in sticky services inflation and the Fed’s bind. The PCE figures confirm the picture the CPI sketched rather than contradicting it: an energy-led headline, a core that refuses to fall the last stretch toward 2 percent, and a central bank with little margin.
The persistence in services is the part that should worry policymakers most. Goods inflation can swing with commodity prices and reverse quickly. Services inflation, which is driven heavily by wages and housing, moves slowly in both directions and is the hardest component to bring down once it sets in. The difficulty of that final stretch is the subject of why the last mile to 2 percent is the hardest, and the April core reading suggests the last mile has not been covered. Readers who want the broader framing of how these monthly releases relate to one another can turn to what the CPI, PCE, and PPI really mean.
Global Impact of PCE Report
A US inflation report is never only a US story. The Federal Reserve sets the price of dollars, and because oil, most commodities, and a large share of global debt are priced in dollars, the Fed’s choices transmit outward. If the April data keeps the Fed on hold while other central banks ease, the interest-rate gap widens, capital flows toward dollar assets, and the dollar strengthens. A stronger dollar raises the cost of imports and dollar-denominated debt for countries across the world, tightening conditions abroad even though the Fed made no decision aimed at them.
This divergence is already underway, and we mapped its mechanics in why the Fed, ECB, BoJ, and BoE are moving in opposite directions. For the United States itself, the structural strengths and pressure points that shape how it absorbs a shock like this are set out in our profile of the US economy, while the contrasting position of Europe, where the energy shock lands on an already weaker growth base, is covered in our profile of the Eurozone economy. The trading partners watching this PCE report are not reading it for curiosity. They are reading it to anticipate the dollar.
Signals Before the June FOMC
The next decision point is the FOMC meeting on June 16–17, the first full cycle in which Chair Kevin Warsh’s preferences will shape the outcome and the messaging. The April PCE data does not settle that decision, but it frames the questions the Committee must answer. The institutional setup behind that meeting, including who votes and how the decision is reached, is laid out in our explainer on the Federal Reserve’s structure and mandate, and the specific challenge facing the new chair is the subject of taking office into stagflation and a divided FOMC.
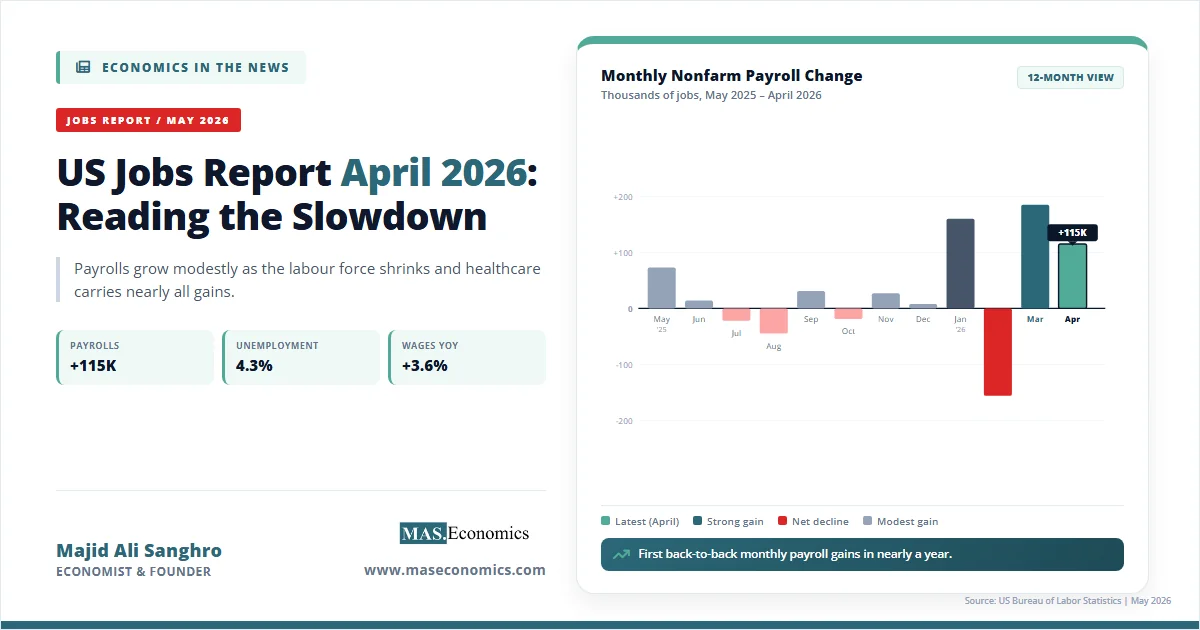
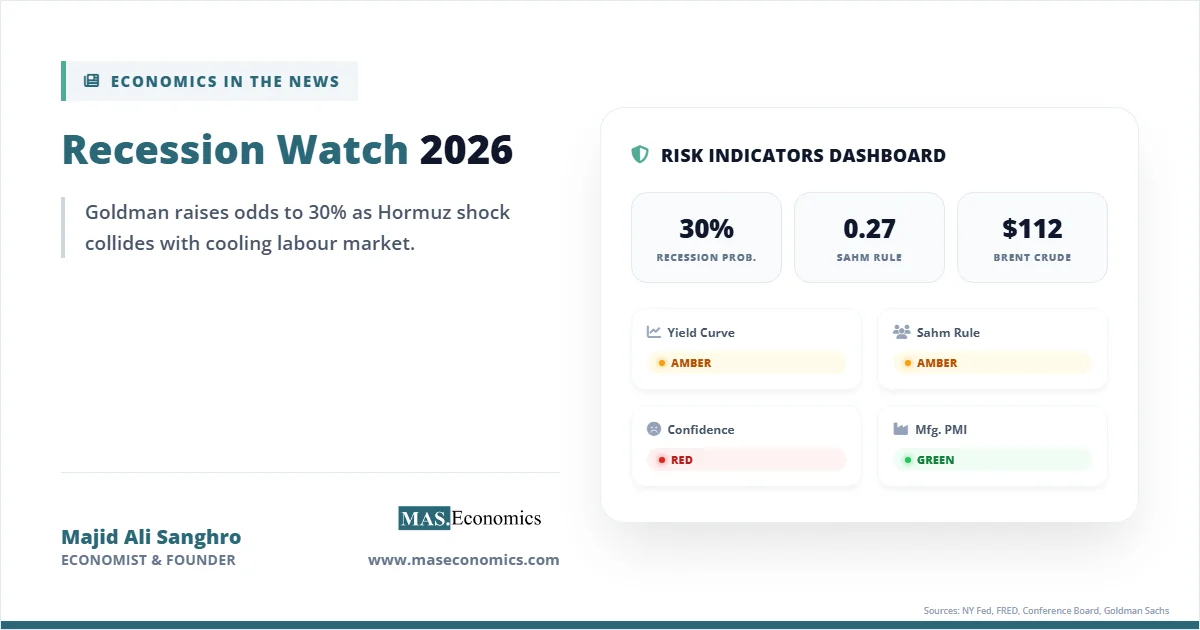
Three signals will matter most between now and then. The first is whether energy prices stabilize or climb further, since a reversal would relieve much of the headline pressure while a further rise would deepen it. The second is the May employment data, because a sharply weaker labor market would shift the balance of risk toward cutting regardless of inflation. The third is the path of core PCE, the cleanest read on whether the energy shock is staying contained or spreading. A growth picture this soft, combined with inflation this high, is the configuration that the recession-watch indicators are built to flag, and June’s meeting will be read closely for any sign of which risk the Fed now considers larger.
Conclusion
The US PCE inflation April 2026 report did not break new analytical ground so much as confirm, in the Fed’s own preferred measure, the bind that the CPI had already suggested. Headline inflation at 3.8 percent is the highest in three years, driven by an energy shock that has not yet fully passed through. Core inflation at 3.3 percent is drifting in the wrong direction. Growth has been revised down to 1.6 percent, and households are sustaining their spending by saving less, not by earning more. Each of those facts points the Federal Reserve toward a different response, and none of them can be satisfied without aggravating another.
The central question is no longer whether inflation is elevated, which the data settles, but whether the energy-driven increase stays contained or seeps into services and wages while long-run expectations remain anchored. As long as those expectations hold near 2 percent, the Fed has reason to treat the shock as temporary and to weigh the softening labor market alongside it. If they slip, the calculus changes sharply. The June FOMC meeting will not resolve that uncertainty, but it will reveal how the new leadership weighs an inflation reading it cannot ignore against a growth picture it cannot dismiss.
Thanks for reading! If you found this helpful, share it with friends and spread the knowledge. Happy learning with MASEconomics