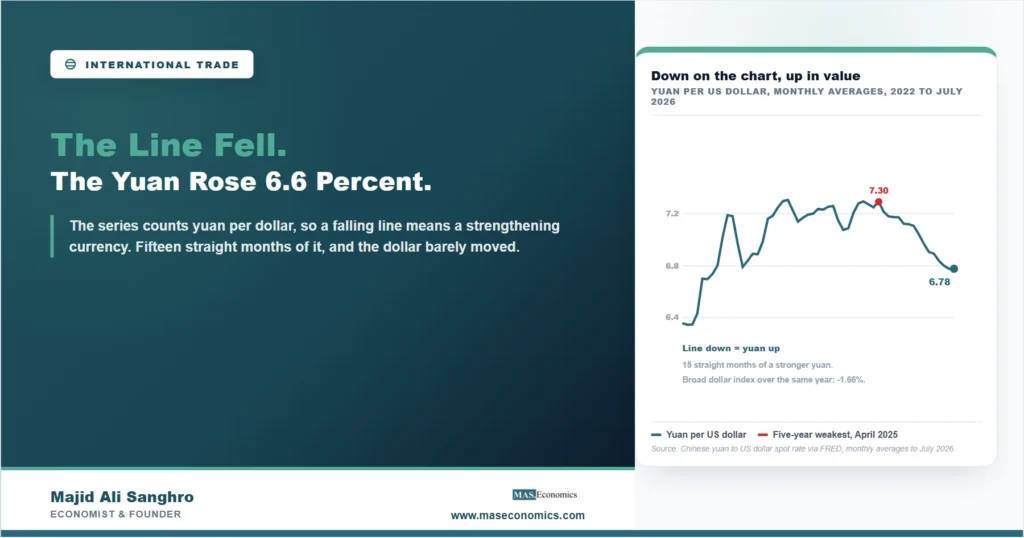
Between the end of July 2025 and the end of July 2026 the number most commonly quoted as the yuan exchange rate went from 7.20 to 6.75. The line on the chart slopes downward for the whole of that stretch. Almost every intuition a reader brings to a falling line is wrong here, because the series is quoted as yuan per US dollar, and fewer yuan per dollar means each yuan buys more. What the falling line records is a 6.6 percent appreciation, one of the larger moves in the currency in a decade, and a great deal of commentary has managed to describe it as a decline.
This is worth more than a note about units. The direction of that move decides whether American consumers pay more or less for goods made in China, whether Chinese households can afford more or less of what they import, and whether Chinese exporters are gaining or losing on price. Getting the sign wrong reverses every one of those conclusions, and the sign is not obvious from the chart.
Which Way Is Up
An exchange rate is a price, and like any price it needs its units stated before it means anything. There are two ways to quote the same relationship, and they move in opposite directions.
| How it is quoted | July 2025 | July 2026 | Change | What it means |
|---|---|---|---|---|
| Yuan per US dollar, the published series | 7.2002 | 6.7509 | -6.24% | A dollar buys fewer yuan |
| US dollars per yuan, the same rate inverted | 0.13889 | 0.14813 | +6.66% | A yuan buys more dollars |

|
||||
Two things in that table catch people out. The first is the direction, already covered. The second is that the two percentages are not the same size. A 6.24 percent fall in one direction is a 6.66 percent rise in the other, because percentage changes are not symmetric under inversion. The correct statement of the currency’s move is the appreciation figure, 6.66 percent, since that is the change in what a yuan is worth. Reporting minus 6.24 percent as though it described the yuan is wrong twice over: wrong in sign and wrong in magnitude.
The move has been persistent rather than sudden. The monthly average has fallen in fifteen consecutive months, from a peak of 7.30 in April 2025 to 6.78 in July 2026, and on 9 April 2025 the daily rate touched 7.35, the weakest the yuan had been in five years. The current level is the strongest since July 2022 on monthly averages, and the last time the daily rate closed at or below 6.75 before this year was 2 February 2023. A one-day move of this size would be a currency event. Fifteen months of it is a trend, and it has been almost invisible in coverage because the line was pointing down.
Yuan Strength, Not Dollar Weakness
The obvious objection is that this is not about the yuan at all: if the dollar were falling against everything, the yuan would rise against it without anything happening in China. That is a testable claim, and the test fails.
| Currency or index | Change against the dollar |
|---|---|
| Chinese yuan | +6.66% |
| Euro | +0.77% |
| Japanese yen | -5.38% |
| Broad US dollar index, all trading partners | -1.66% |
|
|
|
The dollar did soften over the year, but only by 1.66 percent against its broad trade-weighted basket. The euro gained less than a percent. The yen lost more than five. A currency that gains 6.66 percent against a dollar that has fallen 1.66 percent has gained roughly five percent on its own account, and against the yen it has gained about twelve. This is a yuan story, and the arithmetic of separating a currency’s own movement from its counterpart’s is the ordinary discipline described in our explainer on the role of exchange rates in global trade.
A Stronger Currency Alongside a Record Surplus
The reason this matters beyond the currency desk is that it sits awkwardly beside the other large Chinese number of the year. Over the twelve months to April 2026 China ran a merchandise surplus of $1.19 trillion, examined separately in our piece on the size of that surplus. A textbook adjustment story has a large surplus pushing the currency up until exports become expensive enough to close the gap. Part of that is visibly happening. The gap is not closing.
There is no contradiction in that, and the reason is worth stating precisely rather than waving at. Exchange rate movements reach trade balances slowly, because contracts are priced in advance and buyers take time to switch suppliers, so the immediate effect of an appreciation can run the wrong way before it runs the right way. That pattern is the J-curve effect, and whether the eventual effect arrives at all depends on how responsive the quantities are to price, which is the question the Marshall-Lerner condition formalises. Fifteen months is short by the standards of either.
What is not slow is the price effect on people. A 6.66 percent stronger yuan makes Chinese-made goods that much more expensive in dollar terms before any tariff is applied, which lands on American and European importers and eventually on the shelf. It works the other way for Chinese households, whose currency now buys more imported energy, food and machinery, and for Chinese firms servicing dollar debt, whose repayments have become cheaper in domestic terms. The mechanism by which those price changes travel into consumer inflation is set out in our article on exchange rate pass-through, and the size and speed of the effect vary by economy and by product.
Reading Any Exchange Rate Series Safely
The yuan is a good teacher because its convention is the one that trips people, but the problem is general. Some rates are quoted as foreign currency per dollar, so a falling line means a stronger foreign currency. Others are quoted as dollars per unit of foreign currency, so a falling line means a weaker one. Both conventions appear in the same statistical services, sometimes on adjacent pages, and neither is wrong. The same ambiguity runs through any discussion of whether a currency is over or undervalued, which is why the tests built on purchasing power parity always state their units first.
Three habits remove the risk entirely. Read the units in the series title before reading the chart, every time. State the direction in words rather than in signs, because “the yuan strengthened” cannot be misread while “the yuan exchange rate fell 6.24 percent” can. And when converting a move from one quotation to the other, invert first and then compute the percentage, rather than flipping the sign of a percentage that was calculated on the other basis. Those three steps are what separates a 6.66 percent appreciation from a 6.24 percent depreciation, and they are the difference between reading the year correctly and reading it exactly backwards.
MASEconomics Explains
3 economic concepts behind the yuan’s move
These concepts are explored in depth across our educational articles library.
Conclusion
The yuan exchange rate quoted as yuan per dollar fell from 7.20 to 6.75 over the year to July 2026, and that falling line records a 6.66 percent appreciation of the currency rather than a decline. The move has run for fifteen consecutive monthly averages from a five-year low in April 2025, and it has taken the yuan to its strongest level since July 2022, which makes it a sustained repricing rather than a fluctuation.
Two checks confirm the reading. Inverting the quotation gives a rise, not a fall, and gives 6.66 percent rather than 6.24, because percentage changes do not survive inversion unchanged. And the broad dollar index fell only 1.66 percent over the same period, while the yen fell 5.38 percent against the same dollar, so the yuan moved on its own account rather than being carried by a weak counterpart. The consequence follows from the corrected sign: Chinese goods are more expensive abroad and imports are cheaper at home, arriving alongside a record trade surplus that has not yet responded.
Frequently Asked Questions
Did the yuan get stronger or weaker in the year to July 2026?
Stronger. The published series counts yuan per US dollar and fell from 7.2002 to 6.7509, which means a dollar buys fewer yuan than before. Inverted, a yuan bought $0.13889 and now buys $0.14813, an appreciation of 6.66 percent.
Why are the two percentage changes different sizes?
Because percentage changes are not symmetric under inversion. A fall of 6.24 percent in yuan per dollar corresponds to a rise of 6.66 percent in dollars per yuan. The correct figure for the currency’s appreciation is the second one. Flipping the sign of the first gives the wrong magnitude as well as implying the wrong direction.
Is this really the yuan rising, or just the dollar falling?
Mostly the yuan. The broad trade-weighted dollar index fell 1.66 percent over the same twelve months, the euro gained 0.77 percent, and the yen lost 5.38 percent against the dollar. A 6.66 percent gain against a dollar that softened by less than two percent is a move in the yuan itself.
Why has the trade surplus not fallen if the currency has risen?
Exchange rate effects on trade volumes arrive with a long delay, because contracts are priced ahead and buyers take time to switch suppliers. The J-curve describes the initial perverse response, and the Marshall-Lerner condition sets out when the eventual improvement occurs at all. Fifteen months is short relative to either.
Who is affected by a stronger yuan?
Importers of Chinese goods pay more in their own currency before any tariff, and that eventually reaches retail prices. Chinese households gain purchasing power over imported energy, food and machinery, Chinese exporters lose price competitiveness, and Chinese firms with dollar debts find repayment cheaper in domestic terms.
Thanks for reading! A chart that goes down while the thing it measures goes up is not a trick, it is a units problem, and it is the most common one in international economics. Happy learning with MASEconomics