This year’s version of a recurring story says the two big forecasters have split: the IMF expects the world to grow 3.0 percent in 2026, the World Bank 2.5, and half a percentage point of world output is roughly the economy of Germany. Commentary follows about which institution is optimistic and which sees trouble coming. The story has one flaw. The global growth forecasts agree almost exactly, and the proof is printed inside the IMF’s own table, in a memorandum line that reads 2.4 percent.
That line matters because it changes what a reader should do with the two headline numbers. If the institutions genuinely disagreed by half a point, one of them would be wrong about the world economy, and finding out which would be worth a great deal. Since they disagree about almost nothing, the interesting question becomes why the headlines differ anyway, and the answer is a lesson in how world statistics are built that most coverage never reaches.
Four Numbers, One World
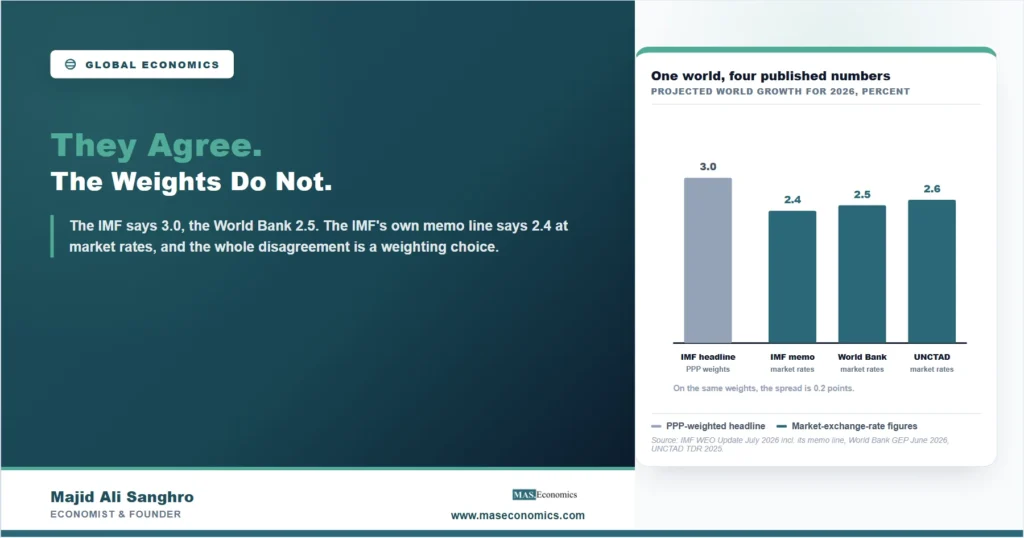
Read the gray bar against the teal ones and the supposed dispute dissolves. The IMF’s headline 3.0 percent is computed with purchasing power parity weights. The same IMF table carries a memorandum line, world growth based on market exchange rates, and that figure is 2.4 percent. The World Bank, which weights at market exchange rates, says 2.5. UNCTAD, which also uses market rates, says 2.6. Weighted the same way, the three institutions sit within a fifth of a percentage point of one another, and the IMF, the supposed optimist of the pair, actually prints the lowest number of the three.
One honesty note belongs beside that chart. The three forecasts are not from the same month: UNCTAD’s dates from before the Middle East war began, the World Bank’s from June 2026, and the IMF’s from July. That the pre-war and post-war market-rate figures still land within 0.2 points of each other is partly coincidence of offsetting revisions. The point of the comparison survives, because the IMF’s 2.4 and the World Bank’s 2.5 are contemporaneous, and they are the pair the “disagreement” story is usually written about.
What the Weights Actually Do
World growth is an average of country growth rates, and an average needs weights. The question the weights answer is how big each economy is, and there are two defensible answers. At market exchange rates, an economy’s size is its output converted to dollars at the rates currency markets set. Under purchasing power parity, its size is measured at the prices its residents actually pay, which raises the weight of economies where a haircut or a hospital visit costs a fraction of its American price.
The difference is not small. PPP weighting increases the measured size of China, India and most other emerging economies, precisely the economies growing fastest, so the world average tilts toward their growth rates and comes out higher. Market weighting leaves the rich world dominant in the average, so the world number tracks slower-growing economies more closely. Neither choice is a mistake. PPP answers a question about how much the world’s production of goods and services is expanding. Market rates answer a question about how fast the world economy is growing in the dollars that cross borders, service debts and settle trade. Our explainer on what GDP measures covers the underlying accounting, and our guide to reading growth figures covers why the same economy can carry several correct growth rates at once.
| Publication | Weighting | World growth, 2026 |
|---|---|---|
| IMF World Economic Outlook Update, July 2026, headline | Purchasing power parity | 3.0% |
| IMF, the same table’s memorandum line | Market exchange rates | 2.4% |
| World Bank Global Economic Prospects, June 2026 | Market exchange rates | 2.5% |
| UNCTAD Trade and Development Report 2025 | Market exchange rates | 2.6% |

|
||
Why the Story Keeps Getting Written
The institutions are not hiding any of this. The IMF prints its market-rate figure in the same table as its headline, one memorandum line down, in the same font. The World Bank’s methodology is stated in its own report. The comparison fails at the point where a reader lifts one headline from each publication and subtracts, which is understandable, because a headline is built to be lifted. The habit of checking what a number is weighted by, measured against, or divided by before comparing it with another is the entire discipline, and it is the same discipline that resolved four other apparent contradictions in our piece on conflicting economic statistics, of which this is the live 2026 case.
There is also a practical reason to care which number you reach for. If the question is global demand for exports, commodities or capital, the market-rate figure is the relevant one, because trade settles at market rates, a point that matters for every comparison in our study of whether deglobalization is real. If the question is how fast humanity’s production and living standards are expanding, PPP is the better lens. A supplier planning export capacity around 3.0 percent world growth is using the wrong number well; the world that buys exports is growing at about 2.5.
What would genuine disagreement look like? Like the fine print, not the headlines. The World Bank’s report carries a downside scenario in which prolonged disruption in the Strait of Hormuz leaves 2026 growth at 1.3 percent, which is a statement about risk, not the baseline. Differences of that kind, about scenarios, channels and risks, are where the institutions actually argue, and they are invisible at the altitude the split story is written from. On the baseline, measured on a common scale, the world’s three main forecasters currently describe the same world: one growing at roughly two and a half percent at market rates, slower than before the pandemic, with the euro area’s stagnation, examined in our piece on a year under one percent, doing much of the dragging.
MASEconomics Explains
3 economic concepts behind the two headlines
These concepts are explored in depth across our educational articles library.
Conclusion
The global growth forecasts for 2026 do not disagree in any way that survives a single memorandum line. The IMF’s 3.0 percent and the World Bank’s 2.5 differ because one is weighted at purchasing power parity and the other at market exchange rates; on the common market-rate scale the IMF says 2.4, the World Bank 2.5 and UNCTAD 2.6, a spread of a fifth of a point, with the institution cast as the optimist printing the lowest figure.
The durable lesson is about reading, not forecasting. A weighted average encodes a choice about what is being measured, and two correct numbers built on different choices will differ forever without either being wrong. Before treating a gap between institutions as information, check the weights. In this case the check takes one line of one table, and it converts a story about a divided profession into the duller, truer story of a world economy growing at about two and a half percent in the dollars that actually change hands.
Frequently Asked Questions
Why does the IMF headline use PPP weights when the World Bank does not?
Institutional convention, each defensible for its purpose. The IMF’s flagship number describes growth in the volume of world production, which PPP measures better. The World Bank’s describes growth at the exchange rates where trade and debt settle. Each publishes or documents the other basis, so the choice is transparent in both cases.
Which number should I use?
It depends on the question. For export demand, commodity markets, debt sustainability or anything settled in dollars, use the market-rate figure of about 2.4 to 2.6 percent. For the pace at which world production and material living standards expand, the PPP figure of 3.0 percent is the better measure.
Why is the PPP figure always higher?
PPP weighting enlarges the measured share of emerging economies, because their domestic price levels are lower than market exchange rates imply. Those same economies grow faster than the rich world, so giving them more weight raises the average. The gap between the two world growth figures is typically around half a percentage point.
Do the institutions ever genuinely disagree?
Yes, but in scenarios and risks rather than baselines. The World Bank’s June 2026 report, for example, carries a downside scenario of 1.3 percent global growth if the Strait of Hormuz disruption persists. Differences over how likely such outcomes are, and through which channels they arrive, are where real analytical disagreement lives.
Are the three forecasts from the same date?
No. UNCTAD’s projection predates the Middle East war, while the World Bank’s is from June 2026 and the IMF’s from July 2026. The cleanest comparison is the contemporaneous IMF-World Bank pair, 2.4 against 2.5 on the same weighting, which is also the pair the disagreement story is usually written about.
Thanks for reading! The next time two institutions seem to disagree about a number, the memo line beneath one of their tables has probably already settled it. Happy learning with MASEconomics