In April 2026 the International Monetary Fund published two different inflation numbers for the same country and the same twelve months. One said 7.2 percent. The other said 11.5 percent. Neither was an error, and by the end of June both had turned out to be very nearly right. Pakistan’s fiscal year closed on 30 June, which makes it the only 2026 inflation forecast on the shelf that can be marked rather than argued about, and the marks are generous: the annual figure missed by two tenths of a point, the year-end figure by four. That result deserves a moment, because it is not how forecasting is usually discussed. The interesting failure here was not the forecast. It was that anyone holding one of those two numbers against the wrong piece of reality could have concluded the Fund was four points out, and could have shown the arithmetic to prove it.
The Only 2026 Forecast That Has Actually Finished
Almost every forecast made for 2026 is still open. Half the calendar year remains, which is why arguments about whether the institutions got it right are, at this point, arguments about temperament rather than evidence. Pakistan is the exception, and for a boring reason: its statistical year runs from July to June, so what the rest of the world calls 2026 was already over there by the time the summer data landed. The Fund’s own statistical appendix lists Pakistan among the economies with exceptional reporting periods, marked July to June, which is the fact that makes the marking possible at all.
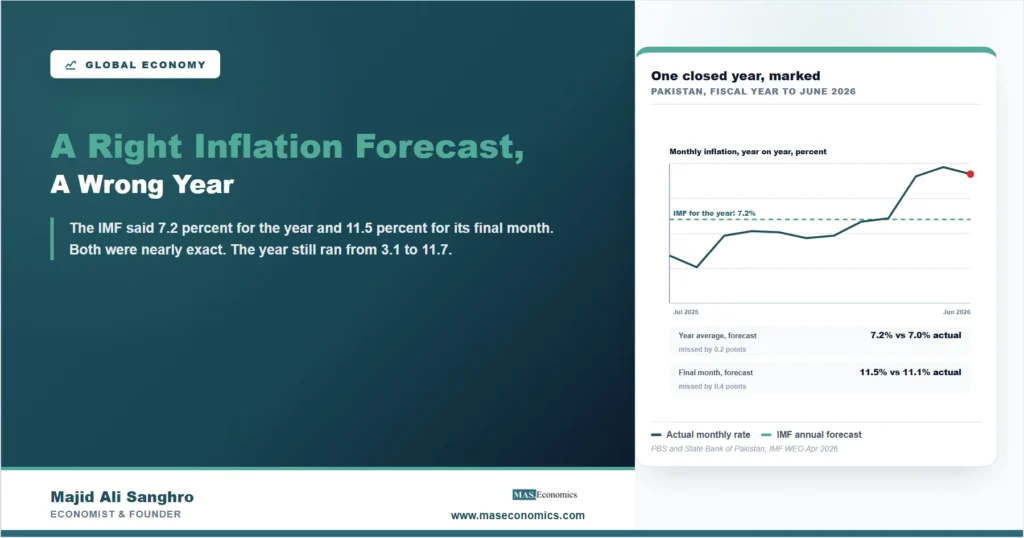
The April 2026 World Economic Outlook carried two projections for that year. The consumer price table gives an annual average of 7.2 percent and an end-of-period figure of 11.5 percent, the second being the year-on-year rate expected in the final month. The outturn is now published. The State Bank of Pakistan recorded national consumer price inflation of 11.1 percent in June 2026, down from 11.7 percent in May, against 3.2 percent in the same month a year earlier. Computed from the national price index across all twelve months, the year’s average inflation was about 7.0 percent. Both projections landed inside half a point.
The previous year is a useful control, because the same table also carried the fiscal year that ended in June 2025: an average of 4.5 percent and an end-of-period figure of 3.2 percent. The outturn was 4.5 percent and 3.2 percent. That is not a coincidence worth celebrating, since by April 2026 most of that year was already history and the Fund was reporting rather than predicting. It does confirm that the two columns mean what they are supposed to mean, which is the part that matters for reading them.
One institution did miss. The Asian Development Bank, publishing in the same month as the Fund, projected 6.4 percent for the same fiscal year. That is six tenths below the outturn against the Fund’s two tenths above it. By its July edition, released after the year had already ended, the Bank had moved to 7.2 percent, which is a revision made with the answer in hand rather than a forecast. The distinction is worth keeping, because a scorecard that treats a post-hoc estimate as a prediction flatters everyone.
| The call | Who, and when | Forecast | Outturn | Miss |
|---|---|---|---|---|
| Pakistan, FY2026 average | IMF, April 2026 | 7.2% | About 7.0% | 0.2 too high |
| Pakistan, FY2026 average | ADB, April 2026 | 6.4% | About 7.0% | 0.6 too low |
| Pakistan, June 2026 rate | IMF, April 2026 | 11.5% | 11.1% | 0.4 too high |
| Pakistan, FY2025 average | IMF, April 2026 | 4.5% | 4.5% | Exact, but reported not predicted |
| United States, 2026 average | IMF, April 2026 | 3.2% | 3.26% at the half year | Still open |
| Euro area, 2026 average | IMF, April 2026 | 2.6% | 2.49% at the half year | Still open |

|
||||
How a Correct Forecast Turns Into a Failed One
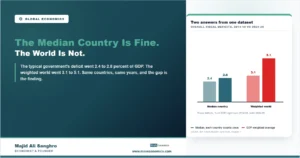
The two Pakistani numbers, 7.2 and 11.5, look like a contradiction and are not. They answer different questions. The annual average asks how much more the whole year cost than the whole year before it, comparing twelve months against twelve months. The end-of-period figure asks how fast prices were rising in one specific month, June against the previous June. In a year where inflation is flat, the two nearly coincide and nobody notices the difference. In a year where inflation climbs steadily, they separate, and the faster the climb the wider they separate.
Pakistan’s year climbed. The twelve monthly rates ran 4.1, 3.1, 5.8, 6.2, 6.1, 5.6, 5.8, 7.0, 7.3, 10.9, 11.7 and 11.1 percent. The lowest month was under a third of the highest. An average of 7.0 percent is an honest summary of that sequence and a poor description of any month in it, which is the trap. Someone who reads the annual figure and then checks the June headline finds a four-point gap and reasonably concludes that somebody was badly wrong. Nobody was wrong. The two numbers were never measuring the same thing, and the gap between them is arithmetic rather than error.
Part of the climb is mechanical. When the comparison month a year earlier was unusually low, the year-on-year rate jumps without anything new happening to prices, and Pakistan’s spring of 2025 was very low indeed, with rates under 1 percent in March and April. Our explainer on base effects covers that mechanism in full, and it is the reason a forecaster can be confident about a year’s average while having very little to say about which month will carry the peak. The average is a property of the price level over twelve months. The monthly rate is a property of two dates, and one of those dates is already fixed by history. Anyone who wants to see how these choices are made from the start will find them in how a consumer price index is built.
The Same Two Numbers Are Already Set for the United States and Europe
The same April table carries the same pair of projections for economies whose year is only half gone, which is where the lesson stops being about Pakistan. For the United States the Fund projected an annual average of 3.2 percent for 2026 and an end-of-period rate of 2.8 percent. For the euro area it projected an average of 2.6 percent and an end-of-period rate of 3.0 percent. Read those four numbers carefully and they contain a claim: American inflation is expected to be higher on average through the year but lower by December, while European inflation is expected to be the other way round. One is a story of a fading shock, the other of a building one.
Halfway through, both averages are close. Measured on the first six months against the same six months of 2025, American consumer price inflation is running at 3.26 percent and euro area harmonized inflation at 2.49 percent, against projections of 3.2 and 2.6. Yet nobody in either economy experienced anything resembling a steady 3 percent. The American monthly rate started the year at 2.39 percent, reached 4.17 percent in May and fell back to 3.46 percent in June, a path that has left the United States with the highest inflation in the rich world. The euro area path ran 1.64 percent in January to 3.14 percent in May, which is why euro area inflation nearly doubled in four months while the annual projection sat still. The gap between an accurate average and a turbulent year is not a European or an American problem. It is what an average is.
This is also where the scorecard gets its warning label. Two of the six rows in the table above cannot be closed yet, and marking them now would be the same error in a different costume. An average over six months is not an average over twelve, and the second half of a year can move a number that the first half made look settled. The honest entry is that both calls are on track, which is a weaker statement than either their defenders or their critics would like. Forecasts should be marked when the period they describe has ended, not when the argument about them peaks. Anyone who has followed the Federal Reserve’s dot plot will recognize the pattern: projections get discussed most intensely in the months when they are least testable.
There is a second reason those rows stay open, and it arrived in July. The Fund’s mid-year update moved its assumed 2026 inflation rate for the United States from 3.2 percent to 3.6, and for the euro area from 2.6 to 2.9. A forecast is not a fixed object waiting to be caught out. It is a sequence of editions, each built on inputs read on a particular day, so an honest score has to name which edition it is marking. The rows above mark April, and they say so.
What the War Actually Moved, in the Forecasters’ Own Numbers
There is a second way to score a forecaster, which is to watch what they change and by how much. The April 2026 World Economic Outlook makes this unusually easy, because its main table prints its own revisions against the January 2026 update, which was written before the war in the Middle East began on 28 February 2026. The revisions are not evenly distributed, and the pattern is the finding.
Between January and April, the Fund moved its 2026 world output projection by two tenths of a percentage point, from about 3.3 to 3.1 percent. It moved its projection for advanced-economy consumer prices up by six tenths. It moved its world trade volume projection up by two tenths. And it moved its oil price projection by 29.9 percentage points, from a fall of roughly 8 percent to a rise of 21.4 percent. The same three months that produced the 2026 oil shock, described by the World Bank as the largest oil supply loss on record, shifted the headline growth number by an amount most readers would not notice. The Fund’s own footnote adds a caution worth repeating: these differences are computed from rounded figures, so a tenth either way is noise.
Read carefully, that is not evidence of complacency. It is evidence that growth aggregates are stiff and price aggregates are not. World output is a weighted sum across two hundred economies, and a shock concentrated in one region has to be very large indeed to move it, whatever it does inside that region. Prices transmit faster and further. So a scorecard that grades only the growth forecast is grading the one number on the page least capable of being wrong, and a forecaster who is regularly caught out on oil is being caught out on the variable that actually reaches a household. It is a version of the same reading error that made the IMF and the World Bank look like they disagree about global growth when the difference was a weighting convention.
How to Mark the Next One
Four questions do most of the work, and they take about a minute each. First, has the period actually ended? A forecast for a year with six months left in it cannot be marked, only monitored. Second, which of the forecaster’s numbers is being quoted, the average across the period or the rate in its final month? Both are usually published and they diverge whenever the trend is steep. Third, when was the forecast made, and what did it already know? A projection published after the data has landed is a report, and it belongs in a different column from a projection published before. Fourth, what is the outturn measured on, and is it the same concept? A national statistical office and an international database can both be right about a country and still print different numbers, a habit examined across four cases in our piece on two credible numbers for the same thing.
None of this is an argument that forecasters deserve more credit than they get. Plenty of forecasts are poor, and the record here covers one closed year in one country plus two open cases. It is an argument that the usual scoring is careless enough that we cannot tell the good from the bad, because the marking uses whichever number came to hand and whichever reality is most recent. The Fund’s Pakistani calls in this cycle were right, and the same institution’s next set may not be. The point of writing the score down while the year is fresh is that in six months nobody will remember what was actually said, and the argument will restart from memory.
MASEconomics Explains
3 economic concepts behind the scorecard
These concepts are explored in depth across our educational articles library.
Explore the MASEconomics BlogConclusion
The only 2026 inflation forecast whose period has actually ended belongs to Pakistan, and it was accurate. The International Monetary Fund projected an annual average of 7.2 percent against an outturn of about 7.0, and a June rate of 11.5 percent against an outturn of 11.1. The Asian Development Bank, forecasting the same year in the same month, came in six tenths low at 6.4 percent. Those are the marks, and they sit awkwardly beside the routine assumption that the institutions are always wrong. What produced the appearance of a large error was not the forecasting. It was the habit of setting an annual average, 7.2 percent, next to a single month’s reading, 11.1 percent, and treating the difference as a miss when the two numbers were never measuring the same thing.
The same pair of numbers is already published for the United States and the euro area, whose years are only half done, and the same confusion is available to anyone who wants it. The Fund put American inflation at 3.2 percent on average for 2026 with 2.8 percent by December, and euro area inflation at 2.6 percent on average with 3.0 percent by December. Six months in, the averages are running at 3.26 and 2.49 percent while the monthly rates have already touched 4.17 and 3.14. Both statements are true at once, and holding them together is the whole skill. When the next edition lands and the verdicts arrive, the useful questions are which number is being quoted, whether the period it covers has finished, and what the forecaster already knew on the day they published.
Frequently Asked Questions
Why can Pakistan’s 2026 forecast be marked when others cannot?
Because its statistical year runs from July to June rather than January to December. The International Monetary Fund lists Pakistan among the economies with exceptional reporting periods on that basis, so the fiscal year the April 2026 forecast described had already ended on 30 June 2026. For economies on a calendar year, half of 2026 is still unmeasured.
What is the difference between period average and end-of-period inflation?
The period average compares the price level across a whole year against the price level across the year before, so it summarizes twelve months against twelve. The end-of-period figure compares one month, usually the last, against the same month a year earlier. In a year when inflation is rising steadily the two can be several points apart without either being wrong.
Does an accurate annual forecast mean people did not feel higher inflation?
No, and that is the point. Pakistan’s twelve monthly rates ran from 3.1 percent to 11.7 percent around an average of about 7.0 percent. A household experiences the monthly rate at the time it shops, not the annual average computed afterwards. A forecast can describe the year correctly and describe no particular month in it.
Which institution forecast Pakistan’s inflation most accurately?
The International Monetary Fund, on this occasion. Its April 2026 projection of 7.2 percent for the fiscal year was two tenths above an outturn of about 7.0 percent. The Asian Development Bank’s April projection of 6.4 percent was six tenths below. The Bank moved to 7.2 percent in July, after the year had closed, which is a revision made with the data rather than a forecast of it.
How much did the 2026 oil shock change the global forecasts?
Very unevenly. Between its January and April 2026 editions the Fund moved its world output projection for 2026 by two tenths of a percentage point, advanced-economy inflation up by six tenths, and its oil price projection by 29.9 percentage points, from an expected fall to an expected rise of 21.4 percent. Growth aggregates are slow to move because they are weighted sums across two hundred economies. Prices are not.
Thanks for reading! The next time a forecast looks four points out, check whether you are holding the same twelve months the forecaster was. Happy learning with MASEconomics