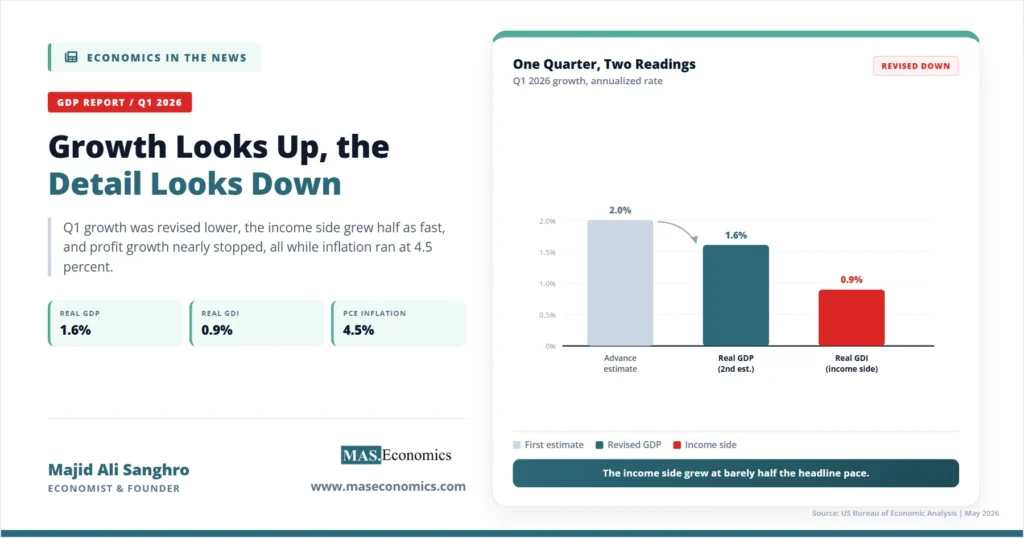
On the same morning the government reported that inflation had reached a three-year high, it also reported that the economy grew faster in the first quarter than it did at the end of last year. Read quickly, that pairing looks reassuring: prices up, but growth holding. Read carefully, it is the opposite. The US GDP Q1 2026 second estimate, released by the Bureau of Economic Analysis on May 28, put real output growth at 1.6 percent annualized, revised down from the 2.0 percent first reported a month earlier and well short of the 2.0 percent Wall Street expected. The economy did accelerate from the fourth quarter’s 0.5 percent, but almost every layer beneath the headline points to an economy that is weaker, not stronger, than the top-line number suggests.
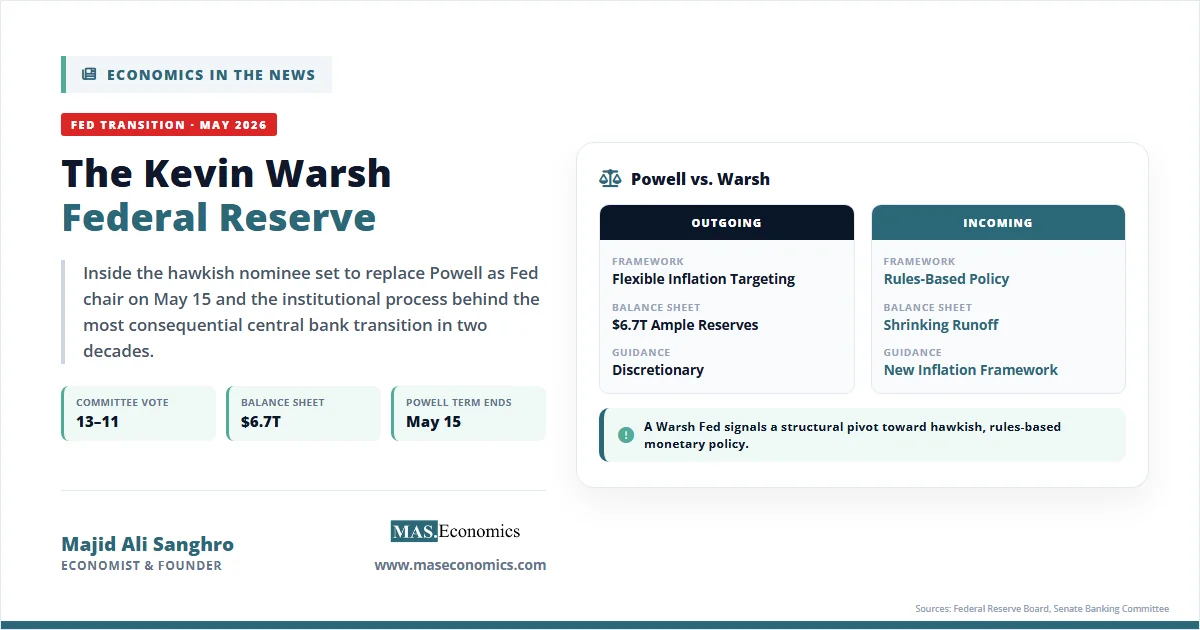
For the United States and the trading partners that watch its data, the report matters because it removes the last comfortable reading of the quarter. Growth was revised down, the income-side measure of the economy grew even more slowly, corporate profit growth nearly stopped, and the inflation embedded in the same release ran at 4.5 percent. This is the configuration economists call stagflationary, and it lands two and a half weeks before the Federal Reserve’s June meeting, the first full policy cycle under new Chair Kevin Warsh. A central bank facing soft growth would normally cut. A central bank facing 4.5 percent inflation cannot. The Q1 report sharpens that conflict rather than resolving it.
Key Revisions in the Second Estimate
The BEA publishes three estimates of each quarter’s GDP as more source data arrives. The advance estimate in April put first-quarter growth at 2.0 percent. The second estimate cut that to 1.6 percent, a downward revision of 0.4 percentage point, driven primarily by weaker investment and consumer spending than first assumed. Within investment, the largest single revision came from private inventory investment in manufacturing and retail, based on updated Census Bureau data. A revision of this size between the first two estimates is not unusual in magnitude, but the direction matters: the economy was doing less in the first quarter than the initial read suggested.
The components that did the lifting are revealing. Business investment was the standout, with equipment spending rising at a 17.2 percent annual rate and intellectual property products up 11.6 percent, both concentrated in information processing and data-center construction tied to the artificial intelligence build-out. Government spending and exports also turned up. Working the other way, residential investment fell for a fifth consecutive quarter, and imports rose faster than exports, so net trade subtracted from growth. The result is an economy leaning heavily on one source of strength, corporate capital spending on AI, while housing contracts and the consumer slows.
| Measure | Q1 2026 (2nd est.) | Q1 2026 (advance) | Q4 2025 |
|---|---|---|---|
| Real GDP growth (annualized) | +1.6% | +2.0% | +0.5% |
| Real GDI growth (annualized) | +0.9% | — | +1.6% |
| Average of GDP and GDI | +1.3% | — | +1.1% |
| PCE price index (in GDP) | +4.5% | +4.5% | +2.9% |
| Core PCE price index (in GDP) | +4.4% | +4.3% | +2.7% |
| Corporate profits (change) | +$40.4B | — | +$246.9B |
|
Source: U.S. Bureau of Economic Analysis, GDP (Second Estimate) and Corporate Profits, 1st Quarter 2026 (released May 28, 2026). Annualized rates.

|
|||
Illusory Acceleration
The headline says growth rose from 0.5 percent to 1.6 percent, an apparent doubling and more. Most of that improvement is a base effect rather than genuine momentum. The fourth quarter of 2025 was held down by a 43-day federal government shutdown that cut federal payrolls and spending through October and November. When the government reopened, that activity resumed, and the resumption is counted as fresh growth in the first quarter even though it largely recovers ground that was temporarily lost. A meaningful share of the quarter-on-quarter acceleration is therefore the mechanical reversal of a one-off drag, not an economy shifting into a higher gear.
The cleaner way to read the underlying pace is to look past the volatile pieces. Real final sales to private domestic purchasers, which strips out government spending and trade and measures private demand directly, rose 2.4 percent. That is the most encouraging figure in the report, and it shows private demand was not collapsing. But it sits alongside a fifth straight quarterly decline in housing and a consumer who, as the companion inflation data showed, sustained spending by drawing down savings rather than from rising real incomes. The picture is of demand propped up rather than accelerating, which is consistent with our framing of what the headline figure does and does not capture in what GDP growth tells us about economic health.
Income Side Weakness
GDP can be measured two ways that should, in principle, give the same answer. The expenditure side adds up what is spent on output. The income side, gross domestic income, adds up what is earned in producing it: wages, profits, interest, and rents. When the two diverge, the gap is informative. In the first quarter, real GDP rose 1.6 percent while real GDI rose only 0.9 percent. The income side of the economy grew at little more than half the pace of the spending side.
Statistical discrepancy between the two measures is normal, but a persistent gap in which income trails spending often signals that the spending-side figure is flattering the true pace of activity. The average of the two, which many economists treat as a more reliable gauge than either alone, rose 1.3 percent. That is the number to hold onto: beneath a 1.6 percent headline that itself was revised down, the broader read on the economy’s growth is closer to 1.3 percent, and the income side is pointing lower still.
Profit Growth Stalled
The companion corporate profits report carried its own warning. Profits from current production rose just 40.4 billion dollars in the first quarter, against an increase of 246.9 billion dollars in the fourth quarter of 2025. Profit growth did not reverse, but it slowed to a fraction of the prior quarter’s pace. Beneath the aggregate, the composition was uneven: domestic nonfinancial profits rose sharply while financial profits and profits earned abroad fell, leaving the total barely positive.
Profits matter for what comes next, not only for what happened. Corporate cash flow funds the business investment that has been carrying growth, and the AI-related capital spending boom depends on firms remaining willing and able to spend. A sharp deceleration in profit growth, if it continues, removes some of the fuel behind the one component holding the economy up. Whether that capital spending is translating into measured output is a separate and unresolved question, one we take up in the AI productivity paradox. For now, the first quarter shows heavy investment and thin profit growth side by side, a combination that cannot persist indefinitely.
Inflation Inside the Growth Report
The GDP release contains its own inflation measures, and they were stark. The PCE price index within the national accounts rose at a 4.5 percent annual rate in the first quarter, unchanged from the advance estimate and up from 2.9 percent in the fourth quarter. Core PCE inside GDP was revised up to 4.4 percent. These quarterly annualized figures run hotter than the monthly year-over-year readings reported separately, because they capture the sharp intra-quarter acceleration as the energy shock hit, but they tell the same story: prices rose fast while real output rose slowly.
That combination is the definition of a stagflationary quarter, the uncomfortable mix of high inflation and weak growth we set out in when inflation and recession hit together. The first quarter’s inflation surge was led by energy as the Strait of Hormuz disruption fed through, but it was not energy alone, since core measures rose almost as much. The same monthly inflation picture, viewed through the Federal Reserve’s preferred gauge, is the subject of our analysis of the April PCE report, and the GDP data confirms that the inflation problem is not confined to a single month or a single category.
Note. The PCE inflation figure inside the GDP release is a quarterly rate expressed at an annual pace, which is why 4.5 percent here looks higher than the 3.8 percent year-over-year headline reported in the monthly PCE release. Both come from the BEA and are consistent; they simply measure over different windows.
Tariff and Supply-Side Backdrop
The first quarter’s weakness is not only about a single energy shock. The economy entered 2026 carrying the heaviest tariff burden since the 1930s, layered on top of the energy disruption and tighter immigration constraints on the labor supply. Each of these acts on the supply side, raising costs and prices while doing nothing to support real output, which is precisely how a supply shock produces the stagflationary signature visible in this report. We traced how the tariff regime reshaped trade and prices in our account of the global tariff war of 2025–2026.
One legal development is worth noting for what it did not do. In February 2026, the Supreme Court ruled that certain tariffs imposed under the International Economic Emergency Powers Act were unlawful and ordered refunds to affected businesses. The BEA treats those refunds as a capital transfer, so they did not affect first-quarter GDP. The tariffs that remained in force, however, continued to feed the cost pressures running through the price data. The broader strengths and vulnerabilities that determine how the United States absorbs shocks like these are set out in our profile of the US economy.
Implications for the June Fed Decision
The first-quarter data lands at the worst possible moment for a central bank that prizes clarity. Growth revised down to 1.6 percent, an income side growing at 0.9 percent, and profit growth that nearly stalled all argue that the economy is more fragile than the headline suggests, which would normally support easing. Inflation at 4.5 percent inside the same report argues forcefully against it. The Federal Reserve cannot lean against the weak growth without risking inflation, and it cannot lean against the inflation without deepening the weakness. The institutional mechanics of how that decision is reached are laid out in our explainer on the Federal Reserve’s structure and mandate, and the specific bind facing the new leadership is the subject of Kevin Warsh taking office into stagflation.
There is also a longer shadow over the report. Growth this soft raises the question of how close the economy is to contracting outright, and the historical record on calling that turn is humbling, as we discuss in how economists predict downturns and why they often miss. A slowing economy also strains the link between output and jobs that Okun’s law describes, which is why the next employment report will be read as closely as this GDP release. The third and final estimate of first-quarter GDP arrives on June 25, after the June meeting, so the Fed will decide on the strength of figures it knows may yet be revised again.
Conclusion
The US GDP Q1 2026 second estimate is a report whose headline and substance point in opposite directions. Growth of 1.6 percent reads as an acceleration from the fourth quarter, but it was revised down from the first estimate; much of the improvement reflects the mechanical reversal of a shutdown-depressed base; the income side of the economy grew at only 0.9 percent; and corporate profit growth nearly stopped. Set against inflation of 4.5 percent in the same release, the quarter carries the stagflationary signature of an economy held up by a narrow band of AI-related investment while housing contracts, the consumer leans on savings, and supply-side costs from tariffs and energy keep prices high.
The central question now is not whether the first quarter was strong, since the layered evidence says it was not, but whether the softness deepens into something worse while inflation stays elevated. The Federal Reserve enters its June meeting with a growth picture it cannot dismiss, and an inflation picture it cannot ignore, and no single move resolves both. The third estimate on June 25 will refine the numbers, but it will not change the shape of the problem: an economy growing too slowly to feel healthy and inflating too quickly to be eased, at the precise moment its central bank must choose which risk to confront first.
Thanks for reading! If you found this helpful, share it with friends and spread the knowledge. Happy learning with MASEconomics